ON THIS PAGE:
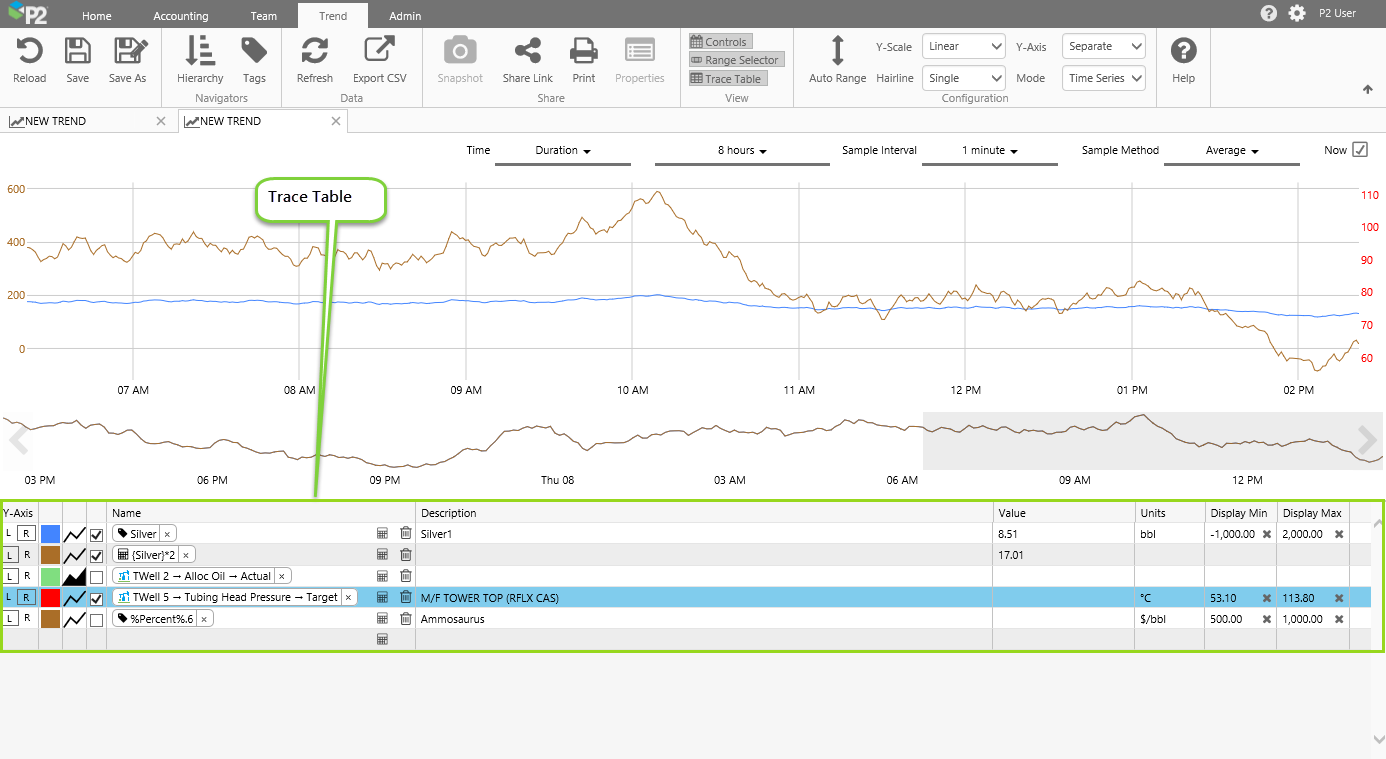
The Trace Table can be found below the trace window and the range selector, at the bottom of the trend.
The trace table displays each trace item. Note that you can only add 20 items, and a warning message appears if you attempt to add more than this. You can configure your trace items by updating the table, and you can add or remove trace items in the table. Your selections are saved when you save the trend, and you can also save your selections to a snapshot of the trend.
To adjust the height of the Trace Table, click and drag its top border.
| 1. | Axis | Trace items get a Left Y-Axis by default. Click L to give an item a Left Y-Axis, and click R to give an item a Right Y-Axis. | ||||||||||
| 2. | Colour | To change the trace colour, click to open the colour wheel, then select a colour or choose a custom colour where you can also set opacity. | ||||||||||
| 3. | Style | To change the trace style, click to open the style wheel, then select from Line, Area, Dot, Step Before, and Step After. | ||||||||||
| This column only appears when the trend is in Time Series mode. | ||||||||||||
| 4. | Show/Hide Trace | Select this to hide the trace, and de-select to show it again. | ||||||||||
| 5. | Name | The trace Name is a full display name of the item which is a tag, attribute value, or calculation. An attribute value could have an underlying value of a tag or a calculation. You can drag an item onto the trend, and the name will insert into a new row automatically. Or you can type a name in, using Auto-Complete. Click the calculator |
||||||||||
| 6. | Description | The description from the underlying tag or calculation. | ||||||||||
| 7. | Value | This shows the values for the respective items in the trace. If the trend has hairlines, then this is the current value from the latest hairline that was added or moved; otherwise, it is the current value from the end-time of the selected time range for the trend. | ||||||||||
| Dual Hairline Statistics | The Value column changes to a drop-down list of Dual Hairline Statistics options, if the trend is in Dual hairline mode, and if two hairlines are selected. Select from one of the following options: | |||||||||||
|
||||||||||||
| Note: The values and statistics in the trace table are calculated using the last known value before each hairline position, whereas the hairline information panel shows the interpolated value at the hairline position. | ||||||||||||
| This column only appears when the trend is in Time Series mode. | ||||||||||||
| 8. | Units | The units from the underlying tag or calculation. | ||||||||||
| 9. | Display Min | The minimum value from the underlying tag or calculation's Display Range (on P2 Server). Click in the box to edit the value. To reset its minimum value as stored in P2 Server, click the |
||||||||||
| 10. | Display Max | The maximum value from the underlying tag or calculation's Display Range (on P2 Server). Click in the box to edit the value. To reset its maximum value as stored in P2 Server, click the |
||||||||||
| 11. | Indicators | Any issues with the data or the data fetch are indicated by an error icon. Hover over the icon to view error details. |
If XY Mode is selected in the ribbon, the X-Axis selector column appears.
Click the radio button next to an item, to assign it to the X-Axis.
Keyboard Shortcuts
When you have focus in the trace table, you can use any of these keyboard shortcuts:
- Arrow Keys: Use the up and down arrows to select a new item in the trace window. If you are editing the Display Min or Display Max of a trace item, use the up and down arrows to increase/decrease by 1.
- Delete Key: Remove the selected trace from the trend.
- Esc Key: Cancel out of whatever you are editing.
- Spacebar: Toggle between showing and hiding the selected trace item.
Trace Name
The item’s Name in the trace table has the following features:
- The name is preceded by an icon, indicating what it is.
- There is a calculator icon
 linking to the Calculation Editor.
 - There is a trash icon
 for removing the trace from the trend.
 - The Name edit box has auto-complete functionality for tags and attributes.
- The name for an attribute value is displayed as: Entity -> Attribute -> Attribute value
The following icons provide information regarding the trace item:
| Icon | Item | Icon | Item |
| Tag | An invalid definition, for example an incomplete attribute definition | ||
| Calculation | Templated attribute | ||
| Attribute: This is the icon for the entity’s primary template, and can vary (e.g. |
OR Attribute (where the entity’s primary template does not have an icon) |
Auto-Complete
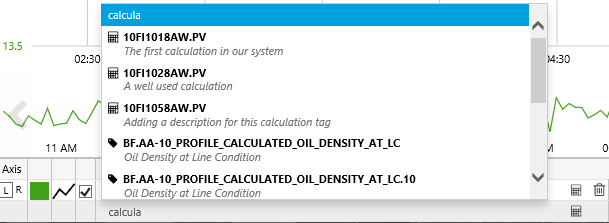
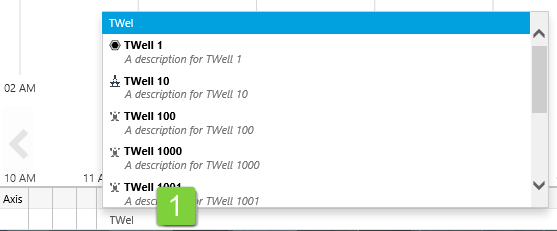
When you start typing a name directly into the Name column for a new item in the trace table, a list of tags, calculations and entities appears, where the name or description matches the search text.
If you are adding an attribute value, you can do this using auto-complete, starting with the entity name, and qualifying until you have the attribute value, as follows:
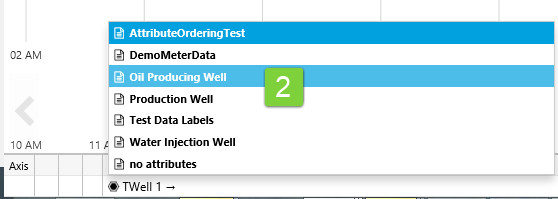
1. Type in part of the entity name, then select an entity (TWell 1) from the list of entities and tags.
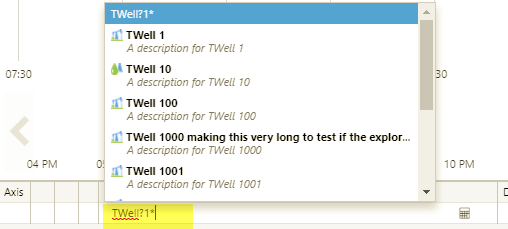
Note: You can also type in wildcard characters (* or ?) if you are searching for a pattern, such as in the screenshot below where we are searching for TWell?1* (all tags/tag descriptions or entities that start with TWell, followed by a character or space, followed by 1, followed by one or more characters). Read more about Searching with Wildcard Filtering.
2. Select a template (Oil Producing Well) from the list of templates for that entity.
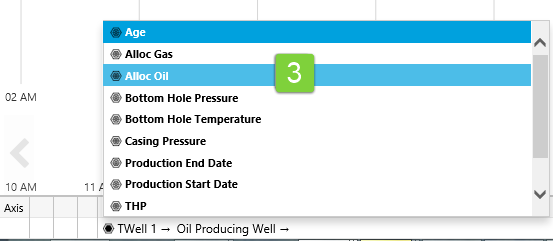
3. Select an attribute (Alloc Oil) from the selected template’s list of attributes.
4. Select an attribute value (Actual) from the selected attribute’s list of attribute values.
The fully-qualified display name appears in the Name column of the trace table.
Calculation Editor
Each item in the trace table has a calculator icon ![]() in the Name column, linking to the Calculation Editor, so that you can add calculations to your trend. (You can also use the Calculation Editor to create a Templated Trend.)
in the Name column, linking to the Calculation Editor, so that you can add calculations to your trend. (You can also use the Calculation Editor to create a Templated Trend.)
To edit a calculation from the trend, or save to a new calculation, click the corresponding calculator icon in the trace table.
The Calculation Editor opens. Add or edit a calculation. Then, if it is a new calculation, either save it or otherwise just use it as an ad hoc calculation for this particular trend if you don't need to re-use it elsewhere. If it is an existing calculation (or one you have just saved) you can save it as a new calculation.
Note that you can also type a calculation directly into the Name column.
Trace Table Video
Several different steps are demonstrated in the video:
- Error message is viewed and dismissed.
- Error item is deleted from the trace table.
- Calculation item is viewed in the calculation editor.
- Various Display Min and Max values are manually updated, and then reset to their stored values.
- Colour and opacity are updated for a trace item.
- A trace item is given an area style, and another one is given a dot style.
- Right Y-Axis is chosen for some of the items.
- The XY Mode is chosen, on the ribbon tab, and we allocate the X-Axis to an item (note how the X-Axis column is added to the table).
- The Time Series Mode is chosen (note how the X-Axis is no longer shown in the table).
- Some of the trace items are hidden from the trace.
- A single hairline is added (note the Value column in the trace table).
- Dual hairlines are added, and the Value column changes to dual hairline statistics (note the various statistics that are selected in the trace table).
Release History
- Trace Table 4.5.5 (this release)
- New column in the Trace Table when XY Mode is selected.
- Trace Table 4.5.4
