Tags and attributes values can be added to trends or viewed on pages, with or without calculations, to help you diagnose problems and visualise value changes over time.
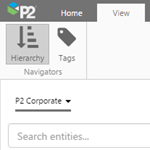
This article shows you how to navigate or search for entities from a selected hierarchy, and then select attributes, as well as how to search for tags. The article also describes what you can do with tags and attribute values.
Read more
The P2 Explorer Ribbon is the main way to access the functionality of P2 Explorer. Find out where you can add a new page or trend, how to search for tags or trends, and more.
Read more
Click through this interactive tour to learn about P2 Explorer Trends.
Read more
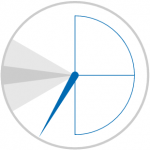
The Wind Vane shows you when the wind direction approaches a direction that may be considered problematic, such as emissions drifting too closely to a settlement. This article describes the changes in the wind vane as the wind direction approaches the 'danger zone'.
Read more
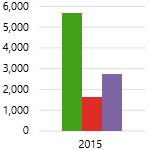
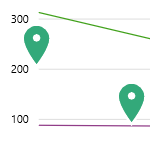
P2 Explorer charts work together with user controls to display your data interactively.
Read more about the different types of charts, and the features they have.
Read more
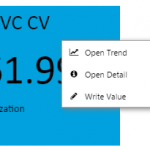
The status indicator (using symbols) and the status tile (using colours) provide an immediate overview of the value status, in relation to thresholds (status indicator) or a limit (status tile). The status tile sometimes has a hyperlink to another page, trend or URL. For status tiles or indicators that display tags or attribute values, you can right-click for menu options.
Read more
Tags and attributes have values that can be added to trends or viewed on pages, as is or as part of calculations, to help you diagnose problems and visualise value changes over time.
This article shows you how to navigate or search for entities from a selected hierarchy, and then select attributes, as well as how to search for tags, in version 4.4.5 of P2 Explorer. The article also describes what you can do with tags and attribute values.
Read more

Search for Pages, Trends or Tags in Explorer, in the Search Page.
You can search for tags by description here, as well as by name.
Read more
This article describes how to move, rename, and delete pages in P2 Explorer.
Read more
Click through this interactive tour to learn about P2 Explorer Trends.
Read more