The Pie Chart shows a circular shape divided into coloured sectors that each represent a proportion of the whole. It is best used when the parts sum up to a meaningful whole and do not overlap. This article describes how to configure a pie chart in versions 4.4 and later of IFS OI Explorer.
Read more
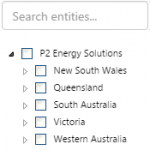
The hierarchy control allows a user to select an entity from a specific hierarchy. This article describes how to configure the hierarchy control, and applies to versions 4.4 and later of IFS OI Explorer.
Read more
Triggers are useful for adding advanced interactions to a page, by regulating variables to conform to certain rules. Triggers currently allow manipulation of entity and time variables.
Read more
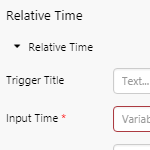
The Relative Time trigger sets a time difference between two datetime variables on a page. It does this by applying a specified time offset to an input variable, and designating this new time to an output variable. This article describes how to configure a Relative Time trigger,
Read more

The R Language infrastructure is available as a separate licensable component for IFS OI Server. This article explains how to configure the R adaptor in order to execute R scripts for the R Language calculation functions.
Read more
The Status Tile displays a value, and is coloured according to the relationship between value and a defined limit. It also has a title and a description, and can include a hyperlink. This article describes how to configure a Status Tile.
Read more
The Status Tile displays a value, and is coloured according to the relationship between value and a defined limit. It also has a title and a description, and can include a hyperlink. This article describes how to configure a Status Tile in versions 4.4.4-4.5.3 of P2 Explorer.
Read more

Hyperlinks provide a useful way to direct the navigational flow between various Explorer pages. They are also useful for opening trends, creating new trends, and opening external sites. This article shows how to configure hyperlinks in versions 4.5.2 and later of P2 Explorer.
Read more
Like Hyperlinks, Hotspots are useful for opening trends, creating new trends, and opening external sites. The Hotspot is transparent and is ideal for overlaying images, text labels, and other components. This article shows how to configure hotspots in versions 4.4.0-4.5.3 of P2 Explorer.
Read more
P2 Explorer charts work together with user controls to display source data interactively. There are several types of charts available, including area chart, line chart, scatter chart, bar chart, and stacked bar chart. Learn about the different types of chart series, how to configure charts to use different types of data, and how to use variables for controlling charts in display mode.
Read more