The Grid Layout allows you to neatly align elements on a page, and is useful for creating dashboard-style layouts. This article describes how to configure the grid layout, and applies to versions 4.4 and later of P2 Explorer.
Read more
The Temperature Meter is used for measuring a temperature against configurable limits. Its appearance changes when limits/alarm thresholds are exceeded.
This article applies to Version 4.4.1 of P2 Explorer.
Read more
The Pressure Meter is used for measuring a pressure reading against configurable limits. Its appearance changes when limits/alarm thresholds are exceeded.
This article applies to Version 4.4.1 of P2 Explorer.
Read more
The gauge shows a numeric value as a needle in relation to target areas. Its appearance changes when limits/alarm thresholds are exceeded.
This article applies to Version 4.4.1 of P2 Explorer.
Read more
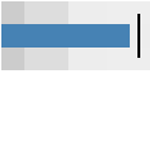
The Bullet Graph is similar to a horizontal bar chart but allows users to compare two values in relation to one another. This article describes how to configure a bullet graph in versions 4.3.2 and earlier of P2 Explorer.
Read more

The Paging Control allows page designers to split up large amounts of tabular data into smaller chunks, or pages. The allows the user to move through those pages to view the data in a table. This is a useful way of displaying many rows of tabular data in a small space. For this component to work with a dataset, paging must be enabled on the dataset. This article describes how to configure the paging component, and applies to version 4.3.2 and earlier of P2 Explorer.
Read more
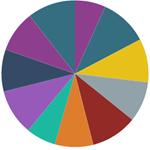
The Pie Chart shows a circular shape divided into coloured sectors that each represent a proportion of the whole. It is best used when the parts sum up to a meaningful whole and do not overlap. This article describes how to configure a pie chart in versions 4.3.2 and earlier of P2 Explorer.
Read more
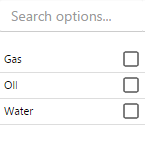
The Multi Select List allows a user to select multiple items from a defined list. If there are more list items than will fit on the page, the Multi Select List displays a scrollbar that provides "infinite scrolling" , and also allows users to filter the list options. This article describes how to configure a multi select list, and applies to versions 4.3.2 and earlier of P2 Explorer.
Read more
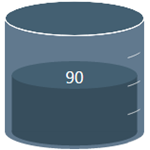
The Tank displays a data value as the percentage fill in a simulated tank shape. This article describes how to configure a tank, and applies to versions 4.3.2 and earlier of P2 Explorer.
Read more

The Target Variance Bar shows a variance value from a target as a bar. By default, the bar is red when the variance is below the target, or grey when the variance is at or above the target. This article describes how to configure a target variance bar, and applies to version 4.3.2 and earlier of P2 Explorer.
Read more