ON THIS PAGE:
Overview
The Paging Control allows page designers to split up large amounts of tabular data into smaller chunks, or pages. This allows the user to move through those pages to view the data in a table. This is a useful way of displaying many rows of tabular data in a small space.
Note: For this component to work with a dataset, paging must be enabled on the dataset.
The following screenshot shows a Paging Control being configured:
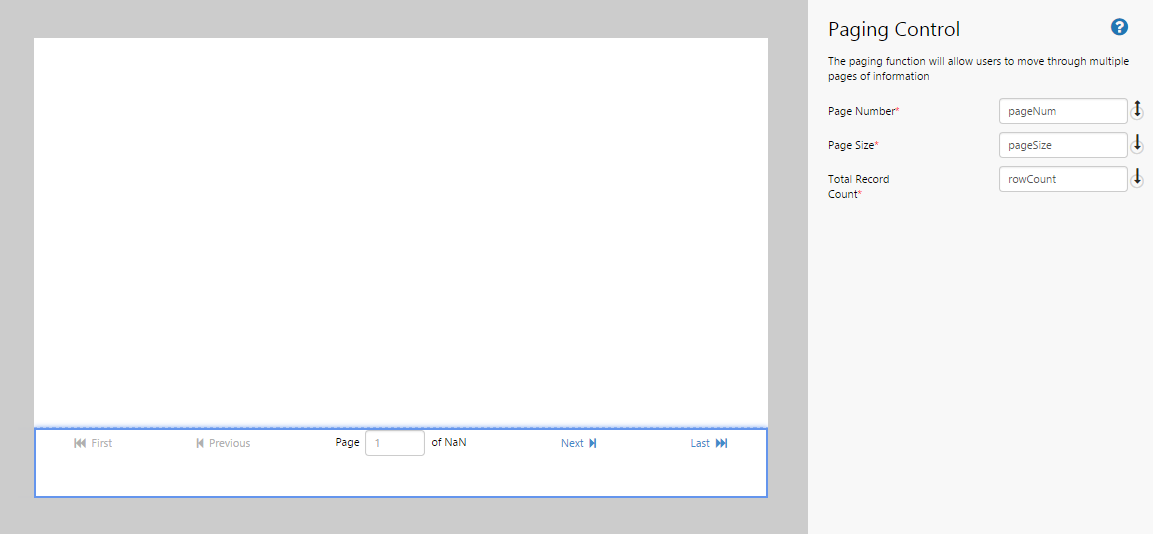
| Page Number: | The number that is published when the user clicks through the page control. This is effectively the page of data that the user is viewing. This event is a parameter of the paging-enabled dataset. |
| Page Size: | The number of rows of data to display in the table. This event is a parameter of the paging-enabled dataset. |
| Total Record Count: | The total number of records in the dataset, rounded up. This is an attribute of the paging-enabled dataset. |
Tutorial
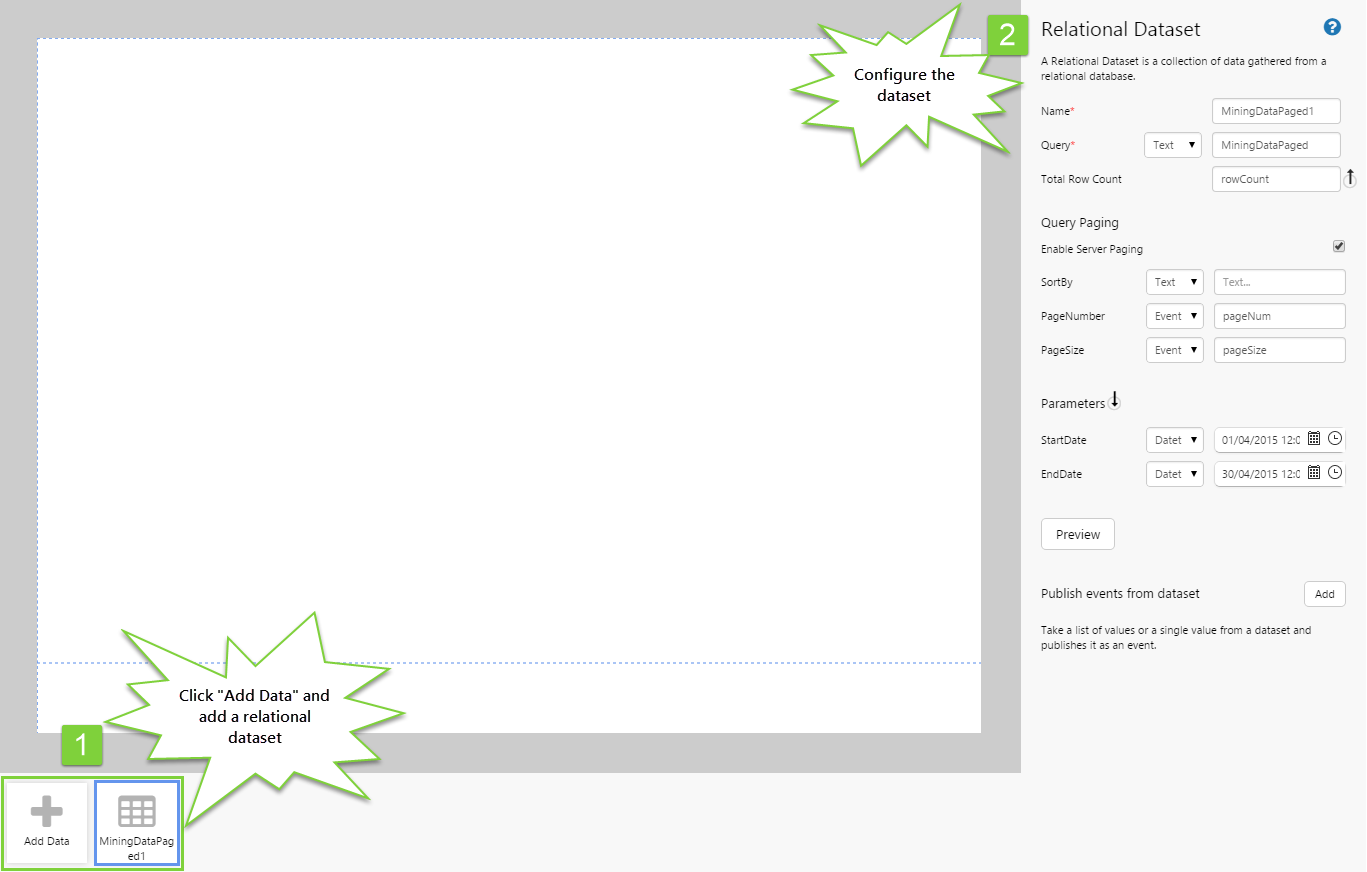
The Paging Control is a useful component that enables users to move through pages of data displayed in a table. However it will only work on datasets that have been enabled for paging. This is done by modifying the dataset query in P2 Server. When the dataset is paging enabled, the configuration panel for the dataset will display an addition section "Query Paging".

The important configuration parameters to note for paged datasets are:
| Total Row Count: | The total number of records in the dataset, rounded up. This is always an event that publishes an attribute of the paging-enabled dataset. This event should only be set for page enabled datasets. |
| Enable Server Paging: | Select this check box to indicate that you want to take advantage of dataset paging. |
| Page Number: | The page number to display when the display is first opened. |
| Page Size: | The number of rows of data to display in the table. |
| SortBy: | The name of the column in the dataset by which to sort the table. Columns containing text will sort alphabetically, those containing numbers will sort numerically, and those containing dates will sort chronologically. |
In this tutorial, we’ll look at adding a Paging Control component that will display pages of data in a large dataset table.

Let’s go through this process, step-by-step.
Step by Step: Displaying a Paging Control for a Large Dataset Table on a Page
Before you start, open a new tab in Explorer and click the “Create a New Page in Studio Mode” thumbnail. Choose the grid layout – you can adjust the rows and columns if you like but it’s not important for this exercise.
You will need to adjust the configuration to suit your data at your site.
Step 1. Add the source data
As the aim here is to display tabular data, the first thing we want to do is add the data we want to display.
The important thing to note here is that the dataset must be enabled for paging. This is done by modifying the dataset query in P2 Server to enable it for paging.
- Add the MiningDataPaged dataset, and configure it as follows:
- Name: MiningDataPaged1
- Query: (Text) MiningDataPaged
- Total Row Count: rowCount
- Enable Server Paging: (select this check box)
- Sortby: (Text) (leave this blank)
- PageNumber: (Event) pageNum
- PageSize: (Event) pageSize
- StartDate: (Datetime) 01/04/2015 12:00:00 AM
- EndDate: (Datetime) 30/04/2015 12:00:00 AM
Note: The Enable Server Paging check box only appears on datasets that are enabled for paging. If this check box is not present, your dataset cannot be paged. You will first need to modify it appropriately in P2 Server.
Step 2. Add the Paging Control component to the page

Drag and drop the Paging Control component onto a grid cell.
Step 3. Configure the Paging Control component

Configure the Paging Control component as follows:
- Page Number: pageNum
- Page Size: pageSize
- Total Record Count: rowCount
These parameters must all be entered as events. We will create defaults for them later in this tutorial.
Step 4. Choose a Dataset to Show along with the Paging Control
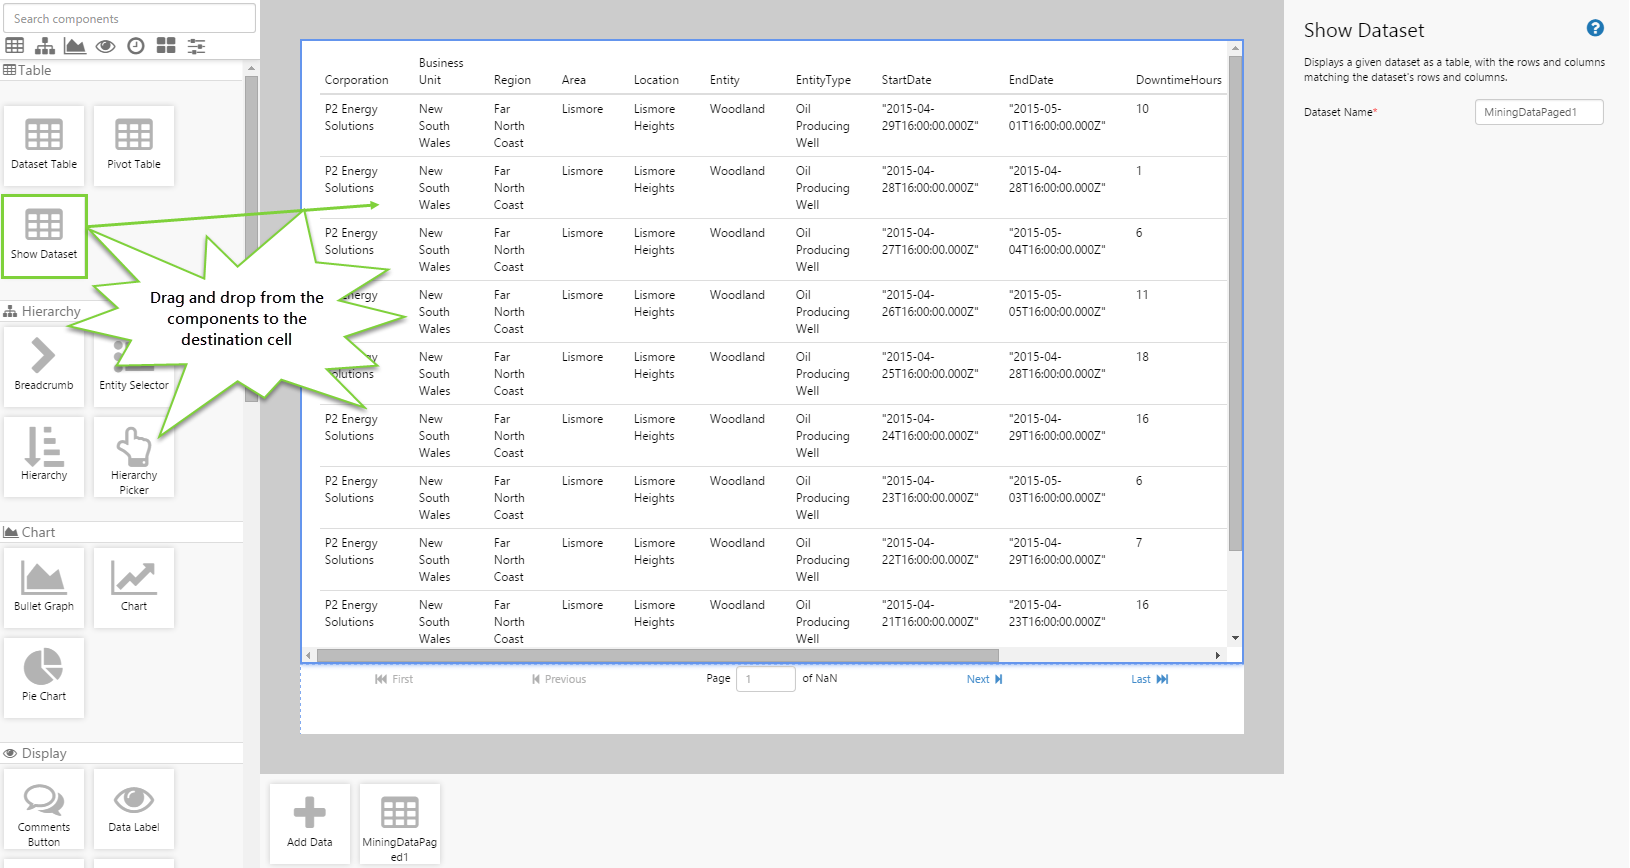
Drag and drop a Show Dataset component onto the canvas, and configure it as follows:
- Dataset Name: MiningDataPaged1
Step 5. Add Event Defaults
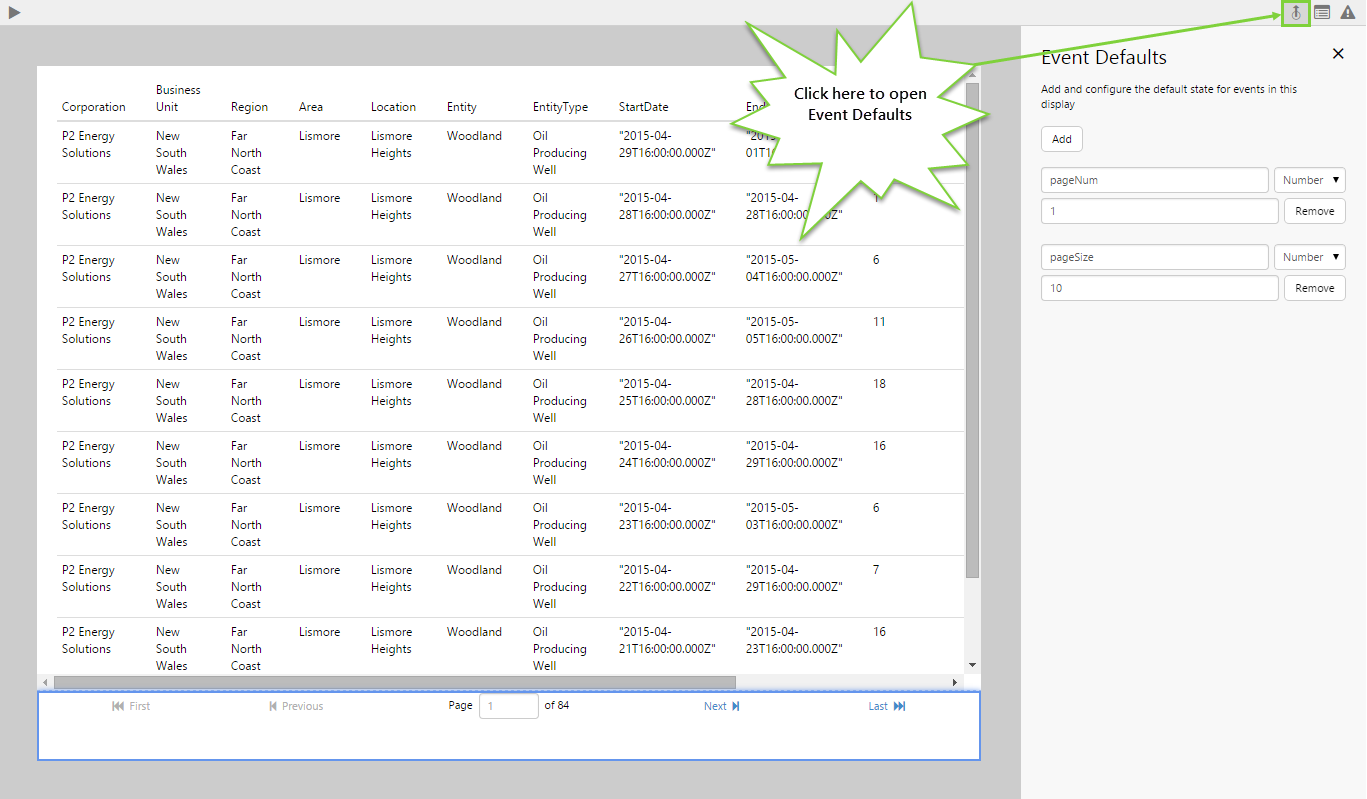
Click the Event Defaults button on the Studio toolbar, and add the following events:
- Add an event called “pageNum” with a Number value of 1
- Add an event called “pageSize” with a Number value of 10
Note: You do not need to add an event default for rowCount, as this is automatically published by the dataset.
Step 6. All done!
Great work! You now have a fully functioning Paging Control that displays the tabular data in pages.
- Click the preview
 button on the Studio toolbar to see what your page will look like in run-time.
 - Click through the pages to get a feel for the behaviour of the control.
- In the settings, change the page number and size to see what happens.
![]() Don’t forget to save your page!
Don’t forget to save your page!