Overview
The Multi Select List allows a user to select multiple items from a defined list. If there are more list items than will fit on the page, the Multi Select List displays a scrollbar that provides "infinite scrolling" , and also allows users to filter the list options.
The Multi Select List publishes an event that is a list of items. This event is typically used as an input to a dataset to filter its data. For example, you may want to obtain a subset of entities from a dataset.
The following diagram shows a Multi Select List component being configured:
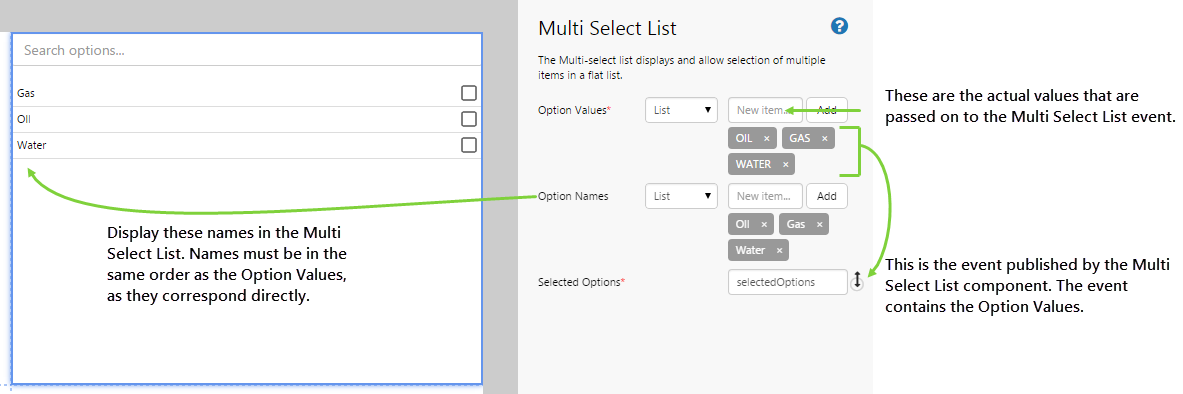
| Option Values: | The text that you want the control to pass to the event it publishes. This can either be a set of values in text format, or you can populate the values from an event. This value is required. |
| Option Names: | The text that you want the control to display in the list. This can either be a set of values in text format, or you can populate the values from an event. The names must be listed in the same order as the values. |
| Selected Option: | The name of the event that is published when the user selects a value from this control. This value is required. |
While this component could be used on a page to select Entities returned from a query, it is important to note that functionality from P2 Server, such as Template Filtering and Data Source Name Replacement, will not be available from this component. Essentially, Explorer will treat these items as text, and not apply any special functionality which could possibly be associated with Entities.
Tutorial
In this tutorial, we’ll look at populating the Multi Select List with entities from a dataset. We'll then use this list to drive a chart that shows the downtime hours for the entities selected from the Multi Select List.

Let’s go through this process, step-by-step.
Step by Step: Populating a Multi Select List From a Dataset
Before you start, open a new tab in Explorer and click the “Create a New Page in Studio Mode” thumbnail. Choose the grid layout – you can adjust the rows and columns if you like but it’s not important for this exercise.
You may need to adjust the configuration to suit the available data at your site.
Step 1. Add and Configure a Text Label

Drag and drop the Text Label component onto a grid cell, and configure it as follows:
- Title: (selected)
- Underline: (selected)
- Content: DOWNTIME ANALYSIS
Step 2. Add the Multi Select List to the page

Drag and drop the Multi Select List component onto a grid cell.
Step 3. Configure the Multi Select List

In this tutorial, we want to populate the Multi Select List from an event that publishes a list of entities. We will create this event in the following steps. For now, configure the Multi Select List as follows:
- Option Values: (Event) Entities
- Option Names: (leave this blank)
- Selected Option: selectedOptions
You’ll notice that the Selected Option event is already filled in with a default event name. You can choose to change this name if you want, but often there’s no real need to.
Step 4. Add Data

So your Multi Select List is now configured, but you need to add some data in order for it to do anything. In this example, we're going to add 2 datasets. The first one we will use to obtain a list of entities to populate the Multi Select List. Let's do this now.
- Add the MiningDowntimePivot dataset, and configure it as follows:
- StartDate: (DateTime) 01/04/2015 12:00:00 AM
- EndDate: (DateTime) 30/04/2015 12:00:00 AM
Let's also add an event for this dataset. This is how the Multi Select List will get populated:
- Click the “Add” button to add the event.
- Configure the event as follows:
- Click “List”
- Event: Entities
- Field: Entity
You'll see the Multi Select List now gets populated with a list of entities. Now we need to add a second dataset that shows us downtime data for oil wells. This dataset accepts the event published from the Multi Select List (selectedOptions) as an input.

- Add the OilDowntimePivot dataset, and configure it as follows:
- StartDate: (DateTime) 01/04/2015 12:00:00 AM
- EndDate: (DateTime) 30/04/2015 12:00:00 AM
- EntitiesList: (Event) selectedOptions
Right now, if you preview your dataset, you will not see any data in the table. This is because no entities have been selected.
- Click the preview
 button on the Studio toolbar to see what your page will look like in run-time.
 - Keeping the Preview window open, select some entities from the Multi Select List. You should see the Preview window being populated with data.
- Toggle the preview button off to proceed with the next step.
Step 5. Add a Chart
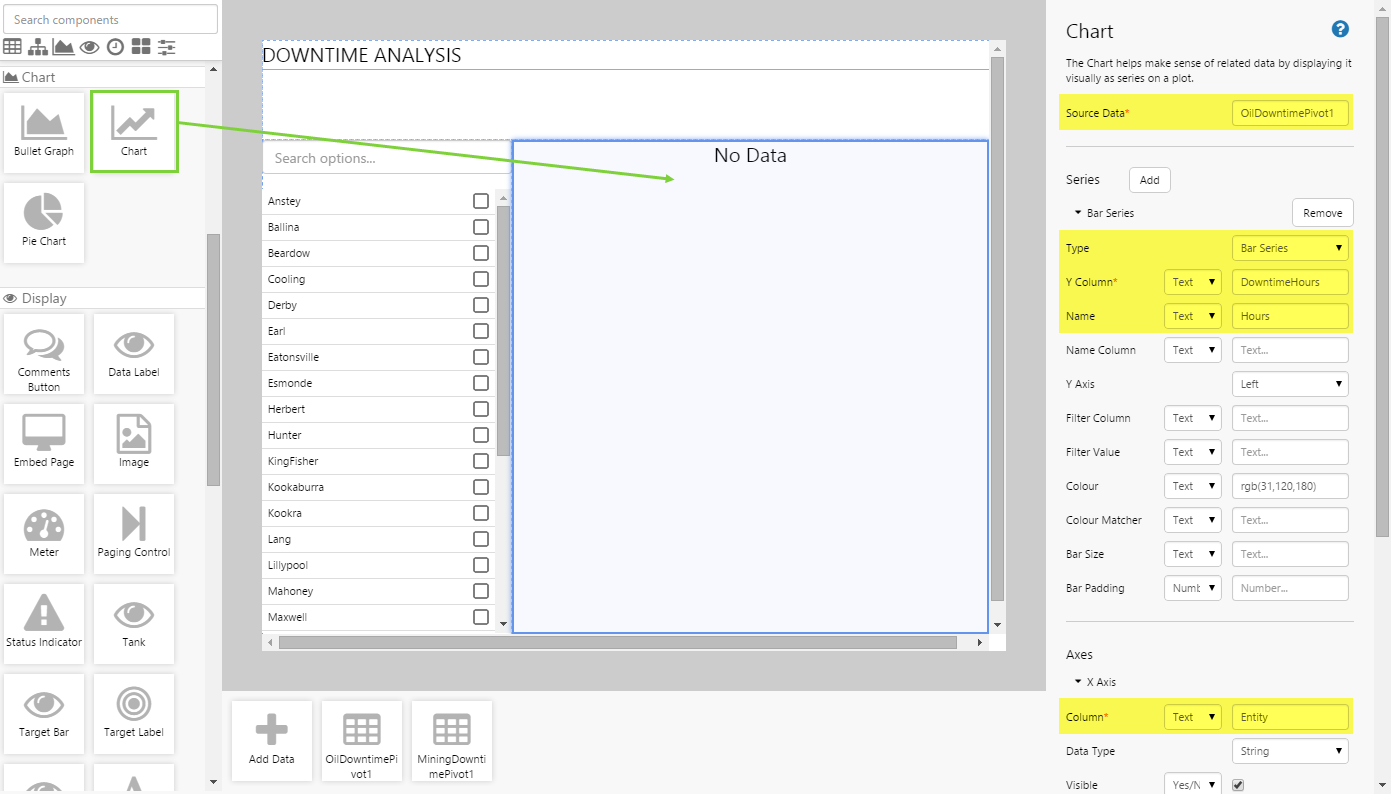
This is the last piece of the puzzle that will show how you can use the Multi Select List. Let’s add a chart and observe it being driven by the Multi Select List.
Drag and drop a Chart onto another cell on the page, and configure it as follows:
- Source Data: OilDowntimePivot1
- Series:
- Type: Bar series
- Y Column: (Text) Downtime Hours
- Name: (Text) Hours
- X Axis:
- Column: (Text) Entity
- Date Type: String
You can configure more chart options if you want, but it’s not necessary for this tutorial.
This chart refers directly to the OilDowntimePivot dataset, and gets the downtime hours for each entity. The only entities available in this dataset are the ones that have been selected from the Multi Select List. The output of the list has been used as an input to restrict the data to only those selected entities.
Step 6. All done!
Congratulations! You now have a fully functioning Multi Select List that displays a list of entities. When you select entities, their downtime hours are displayed in the chart.
- Click the preview button on the Studio toolbar to see what your page will look like in run-time.
- Watch the chart change as you select different entities in the Multi Select List.
![]() Don’t forget to save your page!
Don’t forget to save your page!