Overview
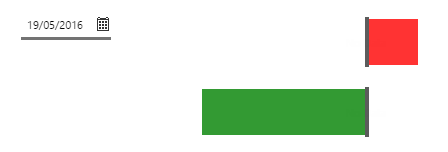
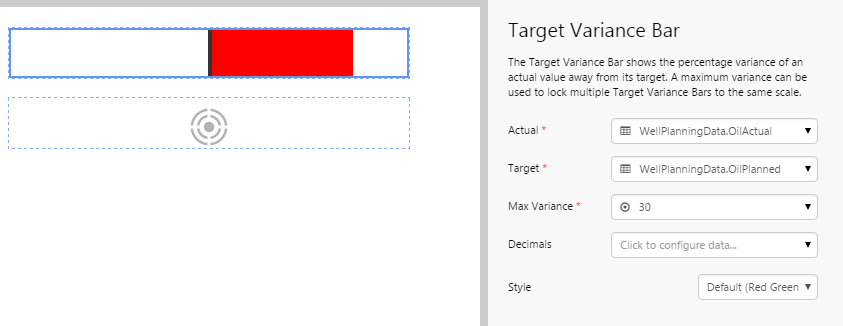
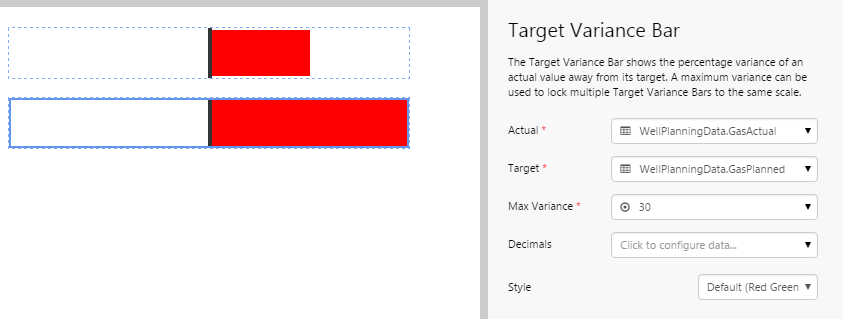
The Target Variance Bar calculates the percentage above or below a target, and displays the result as a bar graph with a target line in the middle.
By default, the bar is green when the value is below the target (left of the line), or red when the value is at or above the target (right of the line).
The following diagram shows a Target Variance Bar being configured:

| Actual: | The actual value that is being compared with the target value. |
| Target: | The value used for the target. |
| Max Variance: | The highest percentage of the actual value over target. This determines the proportion of the bar that is filled. It is commonly used to align multiple Target Variance Bars to the same scale so that comparisons can be more easily made. E.g. If you had 2 Target Variance Bars in a table, you would set the same max variance for all of them so you can see which has the greater variation. |
| Decimals: | The number of decimal points for the actual value displayed in the tooltip. |
| Style: | The style you want to apply to the Target Variance Bar component. If you are a Style Administrator, you can add a new Target Variance Bar style. |
Tutorial: Creating a Target Variance Bar
If you're unfamiliar with the process of building pages, read the article Building an Explorer Page.
The Target Variance Bar is a useful component to display percentage variations of production from target. In this article, we’ll show you how to use the Target Variance Bar to display the variation from planned oil and gas production for a specific well. This is often used in production summary reports.
Let’s go through this process, step-by-step.
Step 1. Prepare a Studio Page
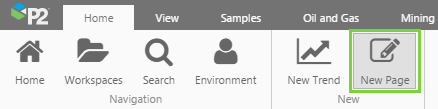
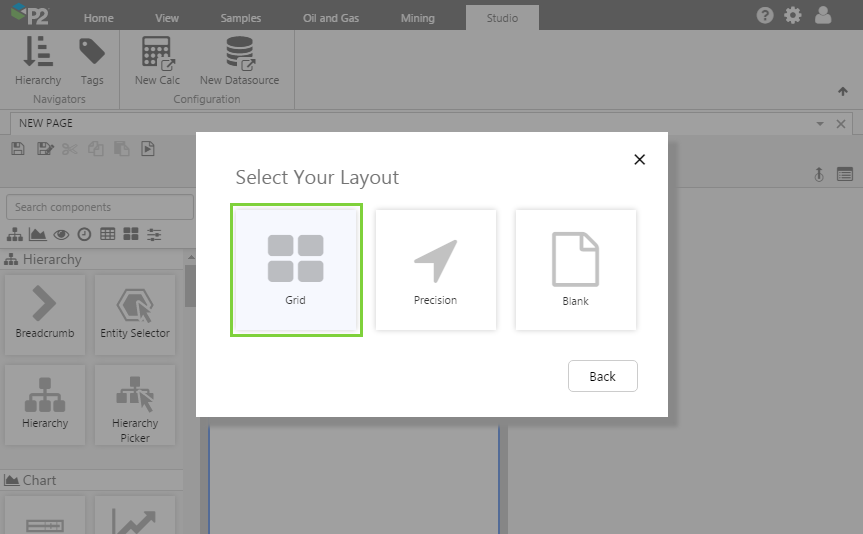
Before you start, click the New Page button on the Home tab of the ribbon. Choose the Grid layout.
- For this exercise, we'll keep the 4 grid cells.
- Assign the first column a width of 200.
- Assign the 2nd column a width of 400.
- Assign a column spacing of 20.
- Assign both rows a height of 50.
- Assign a row spacing of 20.
Step 2. Add the Target Variance Bars
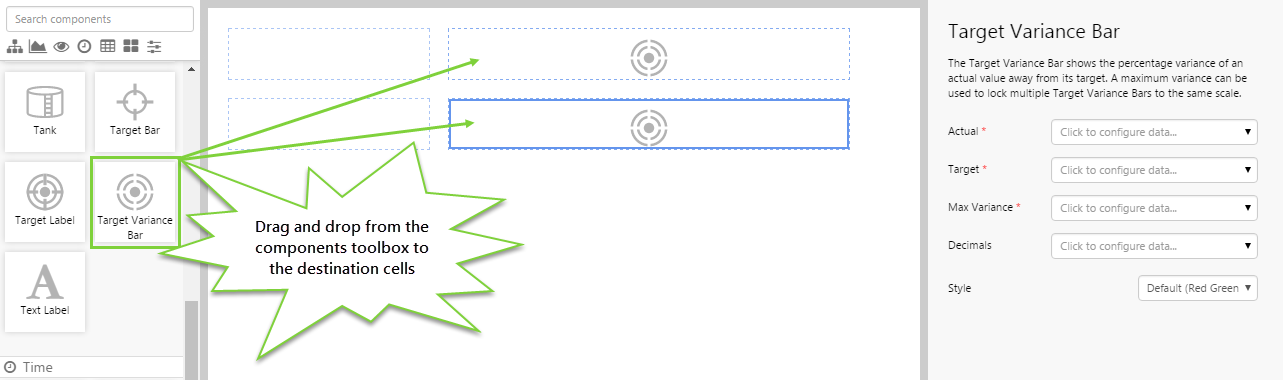
Drag and drop 2 Target Variance Bar components onto the grid. The Target Variance Bar is in the Display ![]() group.
group.
Step 3. Configure the First Target Variance Bar
In this example, we want the Target Variance Bar to show us actual oil production versus planned production and a maximum variance. We'll configure these 3 values separately.
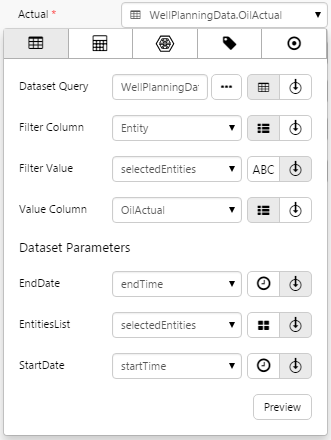
Configuring the Actual Value:
- Open the Actual Data Selector by clicking on the field. You will notice that the Value
 tab is automatically selected. However, for this tutorial, we want to get data from the Well Planning Data dataset query, so click the Dataset
  tab. Fill in the fields as follows:
- Dataset Query: WellPlanningData
- Filter Column: Entity
- Filter Value: (Variable) selectedEntities
Note: You will need to type this in, it will not be available for selection. - Value Column: OilActual
Note: See Filter Column and Filter Value for more information on how these fields work.
- EndDate: (Variable) endTime
- EntitiesList: (Variable) selectedEntities
Note: You will need to type this in, it will not be available for selection. - StartDate: (Variable) startTime
Click the Preview button to check that you are getting data. If the preview window is blank, you may have filled in a parameter incorrectly.
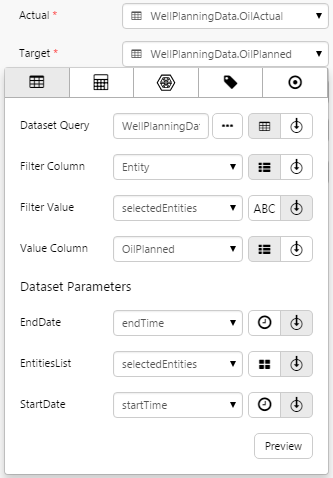
Configuring the Target:
- Click away from the Data Selector.
- Open the Target Data Selector by clicking on the field. Click the Dataset tab. Fill in the fields as follows:
- Dataset Query: WellPlanningData
- Filter Column: Entity
- Filter Value: (Variable) selectedEntities
Note: You will now be able to select this from the drop-down list. - Value Column: OilPlanned
- EndDate: (Variable) endTime
- EntitiesList: (Variable) selectedEntities
Note: You will now be able to select this from the drop-down list. - StartDate: (Variable) startTime
Configuring the Max Variance:
- Click away from the Data Selector.
- Open the Max Variance Data Selector by clicking on the field. Stay on the Value tab.
- Type 30 into the Value field.
Here we are saying that the variation from target should never be more than 30 percent. If the variation ends up being 30% or more, the entire bar will be filled (to the left or right, depending if the value is below or above the target).
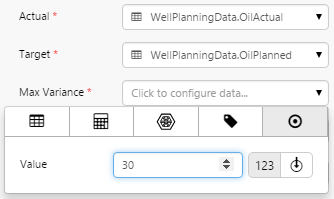
You do not need to fill in the remaining fields.
Step 4. Configure the Second Target Variance Bar
In this example, we want the Target Variance Bar to show us actual gas production versus planned production and a maximum variance. We'll configure these 3 values separately, as we did in the previous step.
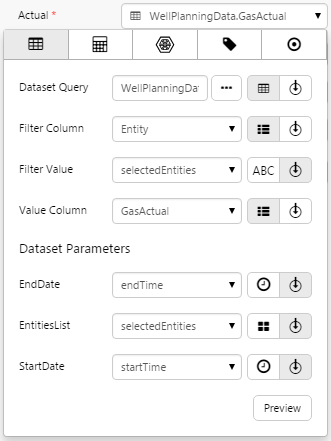
Configuring the Actual Value:
- Open the Actual Data Selector by clicking on the field. Click the Dataset tab and fill in the fields as follows:
- Dataset Query: WellPlanningData
- Filter Column: Entity
- Filter Value: (Variable) selectedEntities
- Value Column: GasActual
- EndDate: (Variable) endTime
- EntitiesList: (Variable) selectedEntities
- StartDate: (Variable) startTime
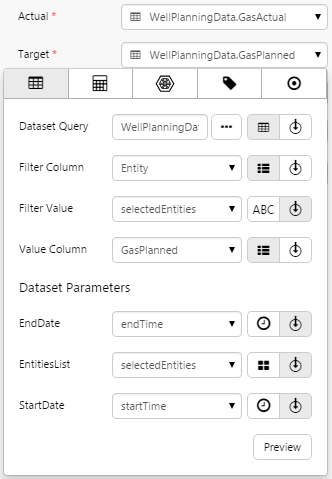
Configuring the Target:
- Click away from the Data Selector.
- Open the Target Data Selector by clicking on the field. Click the Dataset tab and fill in the fields as follows:
- Dataset Query: WellPlanningData
- Filter Column: Entity
- Filter Value: (Variable) selectedEntities
- Value Column: GasPlanned
- EndDate: (Variable) endTime
- EntitiesList: (Variable) selectedEntities
- StartDate: (Variable) startTime
Configuring the Max Variance:
- Click away from the Data Selector.
- Open the Max Variance Data Selector by clicking on the field. Stay on the Value tab.
- Type 30 into the Value field.
We are saying that the variation from target should never be more than 30 percent, as we did for the bar in the previous step. We want them to be aligned so we can more easily compare the variations with each other.
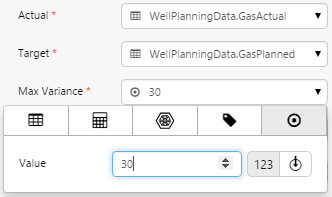
You do not need to fill in the remaining fields.
Step 5. Set the Defaults
At the moment, the page shows the default values that have been set for the WellPlanningData dataset in IFS OI Server. This may not suit your intended purpose.
You should specify default values that are appropriate for your intended purpose.
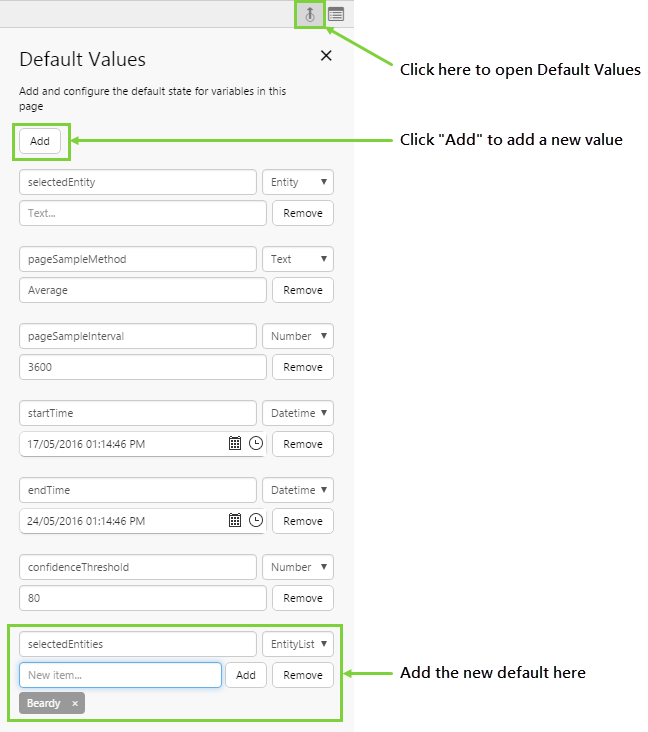
Let’s change the default data that is displayed. We do this by creating defaults for the variables specified in the components in the previous steps. The variable we are interested in is the selectedEntities variable. Let's say we are interested only in the targets for a specific well, Beardy. We can set that here so that the user does not have to specify it.
- Click the Default Values button on the Studio toolbar.
- Click the Add button.
- Add a variable called selectedEntities with a type of EntityList. Type in the following entity name: Beardy
You should now see the Target Variance Bars update to reflect the new default.
Step 6. Add the Date Picker
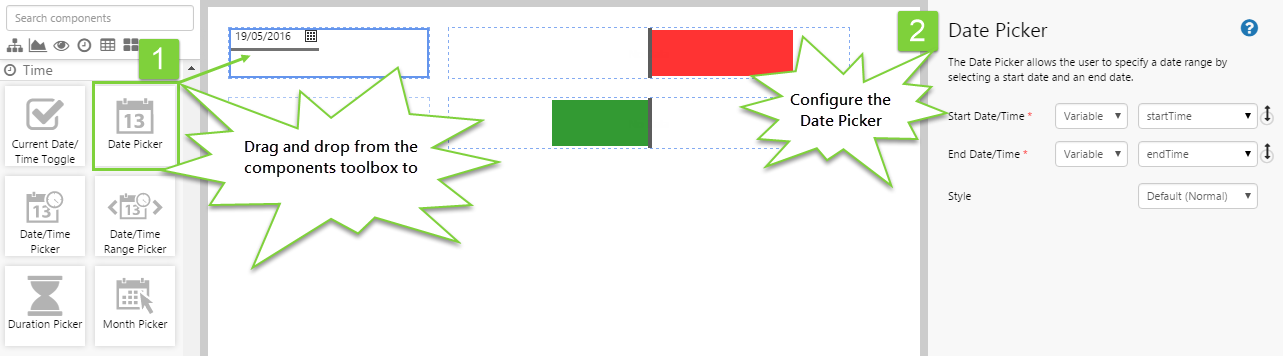
This step allows the user to select a date, which will update the Target Variance Bars with values for the selected date.
- Drag and drop the Date Picker component onto the canvas.
- There is no need for further configuration as we are able to use the default values for Start Date/Time and End Date/Time. We used these variables during configuration of the Target Variance Bars.
Step 7. All done!
Congratulations! You now have two Target Variance Bars that will show you the percentage variation from planned oil and gas production for a specific well.
- Click the preview
 button on the Studio toolbar to see what your page will look like in run-time.
 - Select different dates and observe the changes in the target variance bars.
![]() Don’t forget to save your page!
Don’t forget to save your page!