ON THIS PAGE:
The hairline allows you to see the data values on a chart, embedded trend or trend, at a particular point in time.
Hairline Features
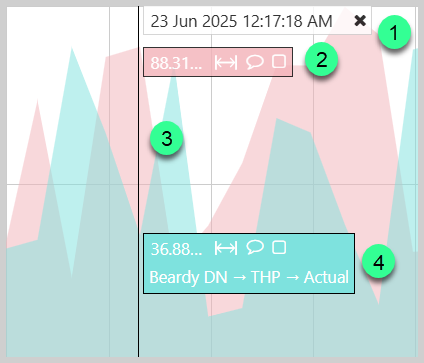
The hairline can show:
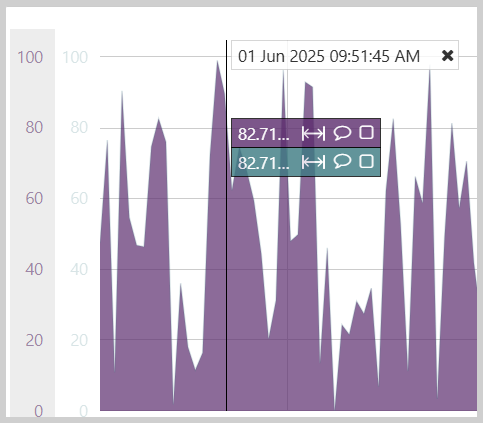
- The timestamp of the data point
- The current value of the trace or series
- The name of the trace or series
- The difference between hairline values (for two or more hairlines)
- Comments button
- Time Windows button (only available on a trend hairline)
- Case button (only displayed when the trace is of an entity)
Note that hairlines can be configured to hide some of these items (see Hairline Display Options).
A hairline:
 |
|
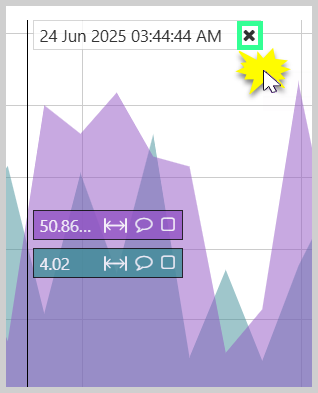
A hairline pill:
 |
|
Hairline Display Options
By selecting different configuration options in Trends, Embedded Trends and Charts, you can determine what is displayed on the hairline pill.
Trends
Use the Hairline view option in trend toolbar to configure what appears in the trend hairline pill.
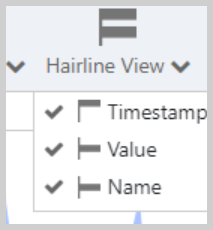
From the dropdown, select which data (Timestamp, Value, Name) to be displayed.
- Timestamp: time at which the hairline intersects the data point.
- Value: numerical value of the data at the hairline’s position.
- Name: name of the tag, attribute, or calculation associated with the data point.
The on-hover behavior continues to display the tag, attribute, or calculation name, even if it is not selected in the Hairline View.
Embedded Trends
Embedded trends have two configuration areas:
|
Page configuration:
|
Toolbar configuration:
|
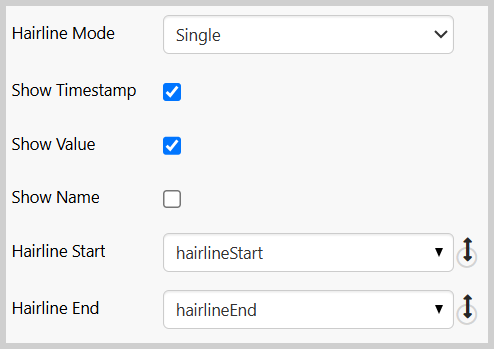
- Page Configuration
- Hairline Mode determines the number of hairlines to be shown (None, Single, Dual or Multiple).
- Use checkboxes to show or hide Timestamp, Value and Name.
- Hairline Start: The time of the line at the left-most hairline. If the Hairline Mode is Single, Hairline Start and Hairline End will have the same value.
- Hairline End: The time of the line at the right-most hairline.
-
Toolbar Configuration
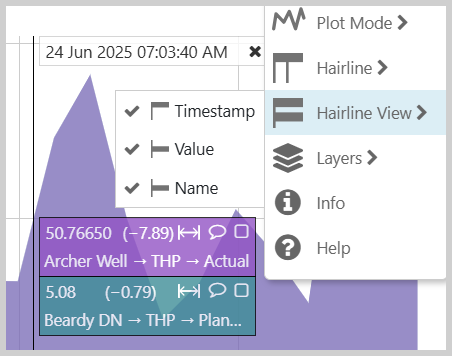
- Hairline View dropdown lets you choose which elements (Timestamp, Value, Name) are shown in the pill when using the toolbar.
Charts
Hairlines are available only for continuous charts (X Axis data type is Time or Number).
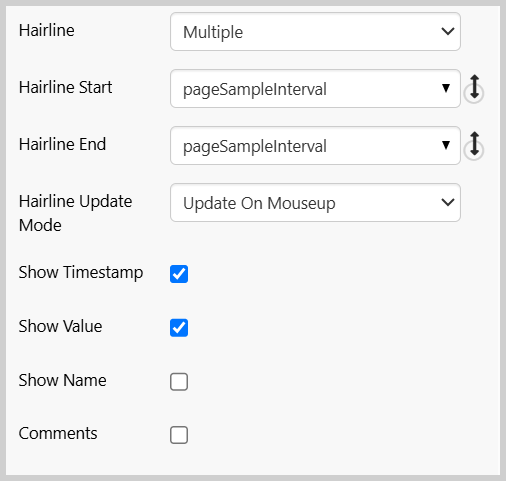
Select a Hairline View mode: Single, Dual, or Multiple to enable hairline display configuration options.
- Hairline Start: The time of the line at the left-most hairline. If the Hairline Mode is Single, Hairline Start and Hairline End will have the same value.
- Hairline End: The time of the line at the right-most hairline.
- Hairline Update Mode: Set the hairline to be updated either as the user is actively dragging the hairline (Update On Drag), or after the user has finished dragging (Update On Mouseup). 'Update on Mouseup' is useful when a large amount of data is being returned.
- Display Options: Use checkboxes to show or hide Timestamp, Value, Name, and Comments on the hairline pill.
Note: When a trend or embedded trend, has Dual hairlines selected, and there are two hairlines on the trend, then Dual Hairline Statistics options (e.g. 'Max', 'Min', 'Standard Deviation') are available in the trend's Trace Table, allowing you to make further comparisons between data at the points marked by the two hairlines.
Hairline Behavior
- For dot series, interpolation for values in hairlines is Last Known Value.
- If a series/trace contains no value (or a null value), the pill will not appear.
Interacting with a Hairline
Add a hairline
- Click on a hairline-enabled chart or trend. The hairline is added where you click.
Add More than One Hairline
To add more than one hairline, configure the Hairline Mode to either Dual or Multiple in the chart or trend.
- Dual Mode: allows two hairlines to be placed on the chart.
- Multiple Mode: enables placing more than two hairlines.
To add multiple hairlines, click on the chart or trend to place each hairline. Each click adds a new hairline (up to the configured limit).
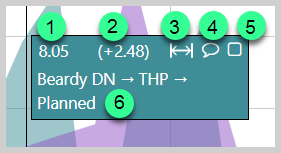
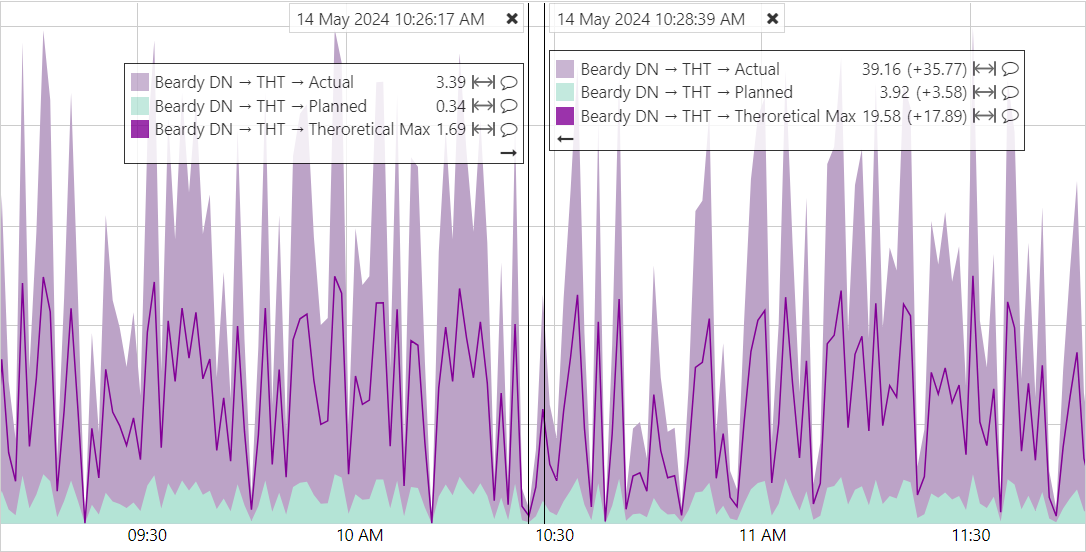
Each hairline displays its own pill with the selected information (e.g., timestamp, value, name), and the pill color matches the trace or series color.
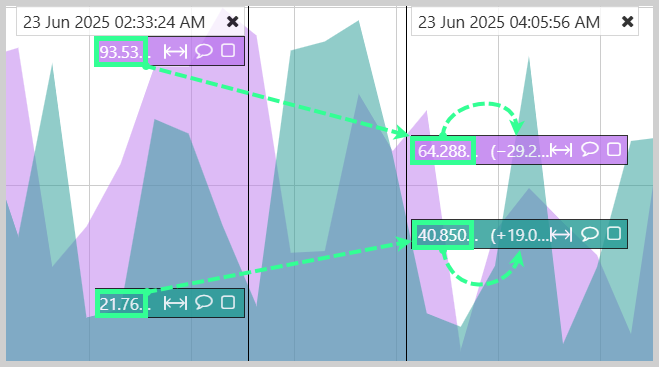
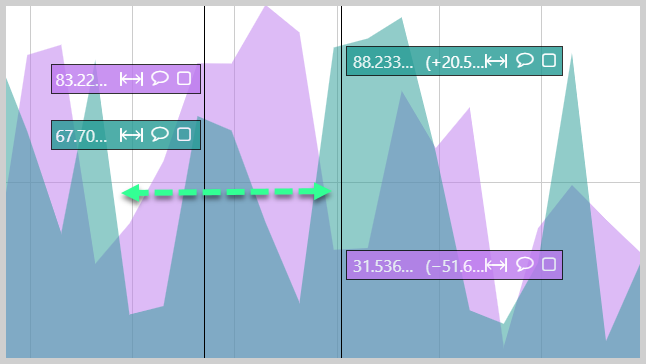
Value Difference is displayed when there are two or more hairlines. The value difference applies to a hairline's values, and those of the hairline immediately to its left.
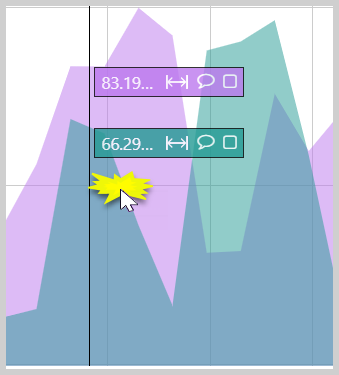
Move a hairline
- To move a hairline left or right, click the hairline and drag it to the left or right.
- When you move hairlines so that they approach each other, the information boxes flip so that the values are not obscured.

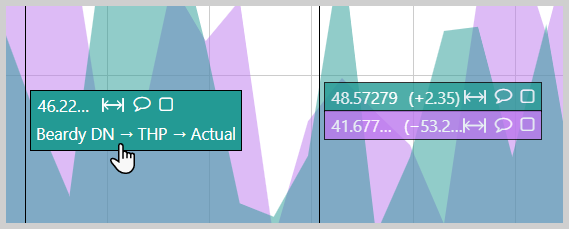
Hover
- Hover over a data item's information box to see more information on the data item.
Select an axis
- When both Y-axes are enabled, hovering over one of the axes causes the hairline on the non-selected axis to fade.
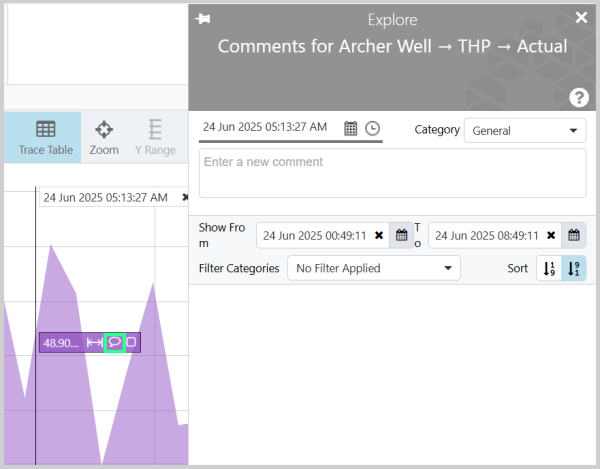
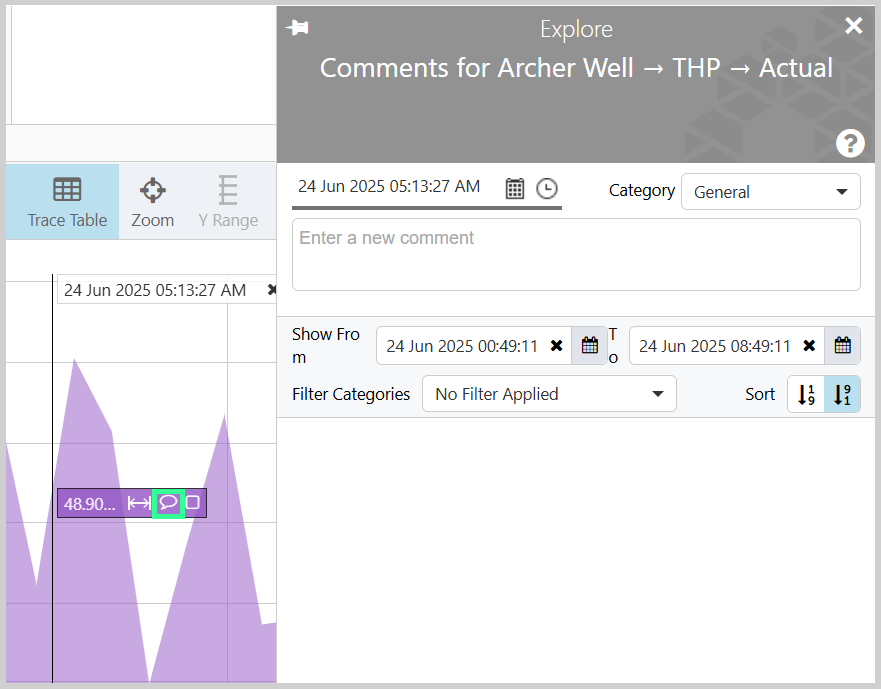
Add comments
- Click the comment
 icon to view or add comments for the data item.
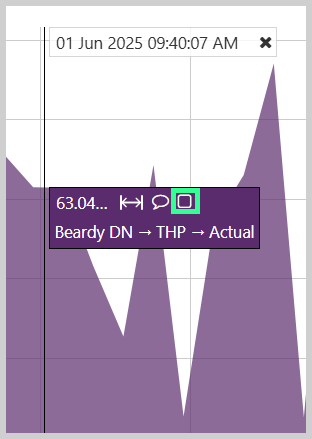
Create a Case
-
- Click the case icon in the hairline pill to create a new case.
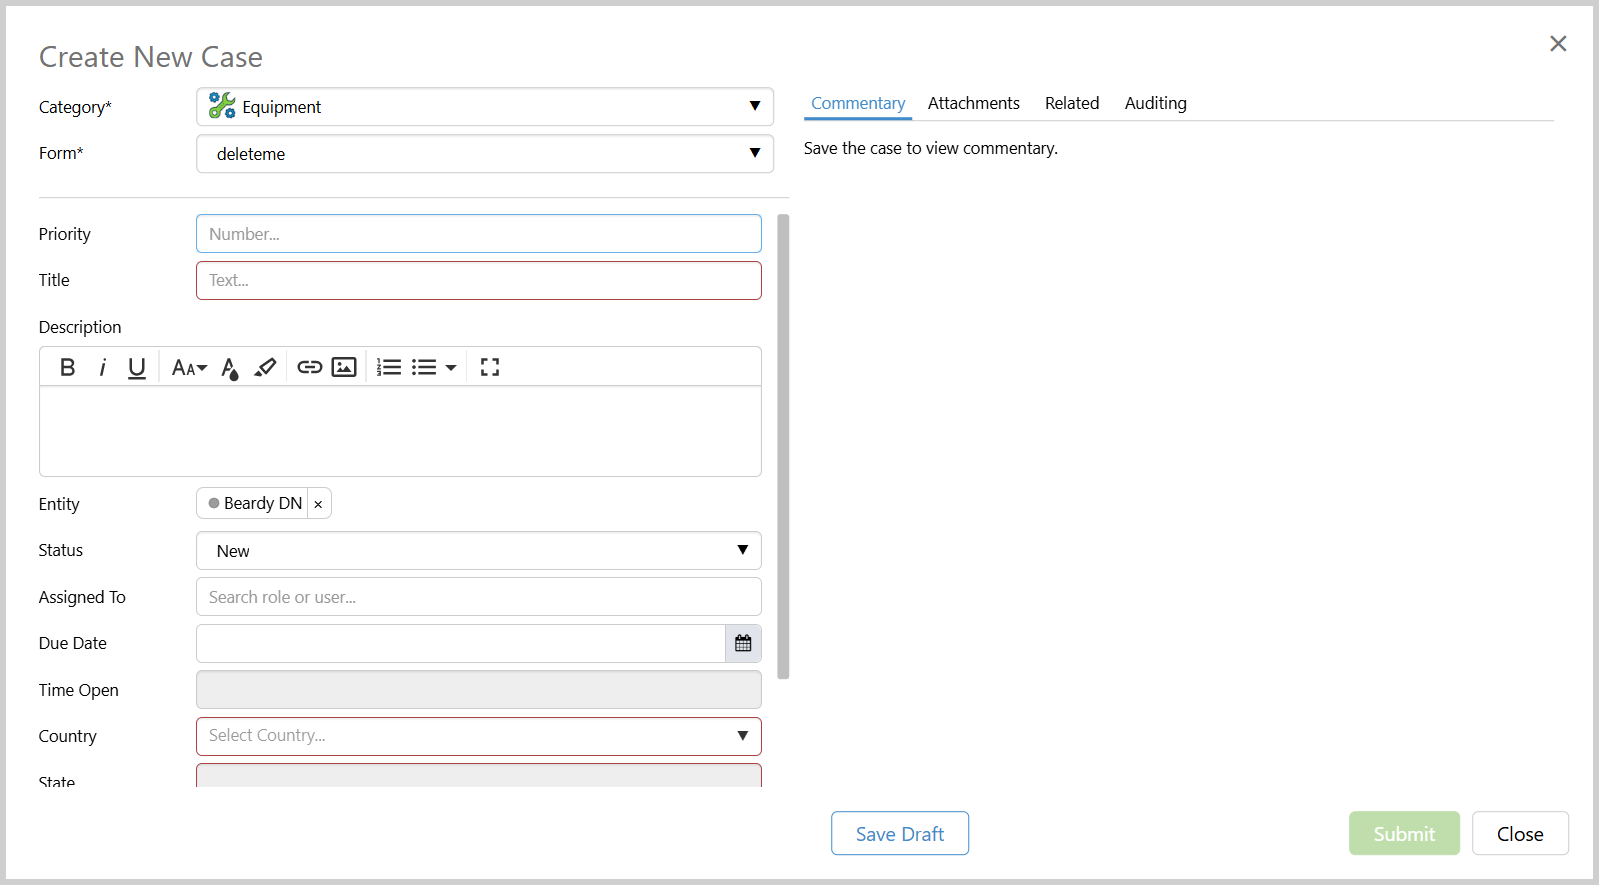
- The new case entry dialog will open.
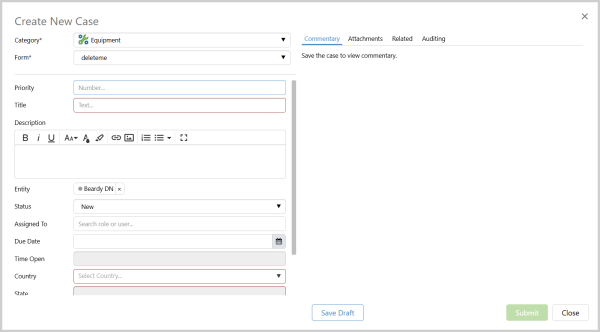
- Fill out the necessary fields and click submit.
- Click the case icon in the hairline pill to create a new case.
Note: The case button is only displayed when the trace is of an entity.
Close a hairline
- Click the Close
 button at the end of the timestamp box.
Hairline Behavior When Fixed Period Extends Beyond Current Time
When changes to the fixed period of a trend result in the end time extending into the future where no data exists, the end time will be set to the current time. Additionally, the hairline will remain in its set position and will not automatically re-center.
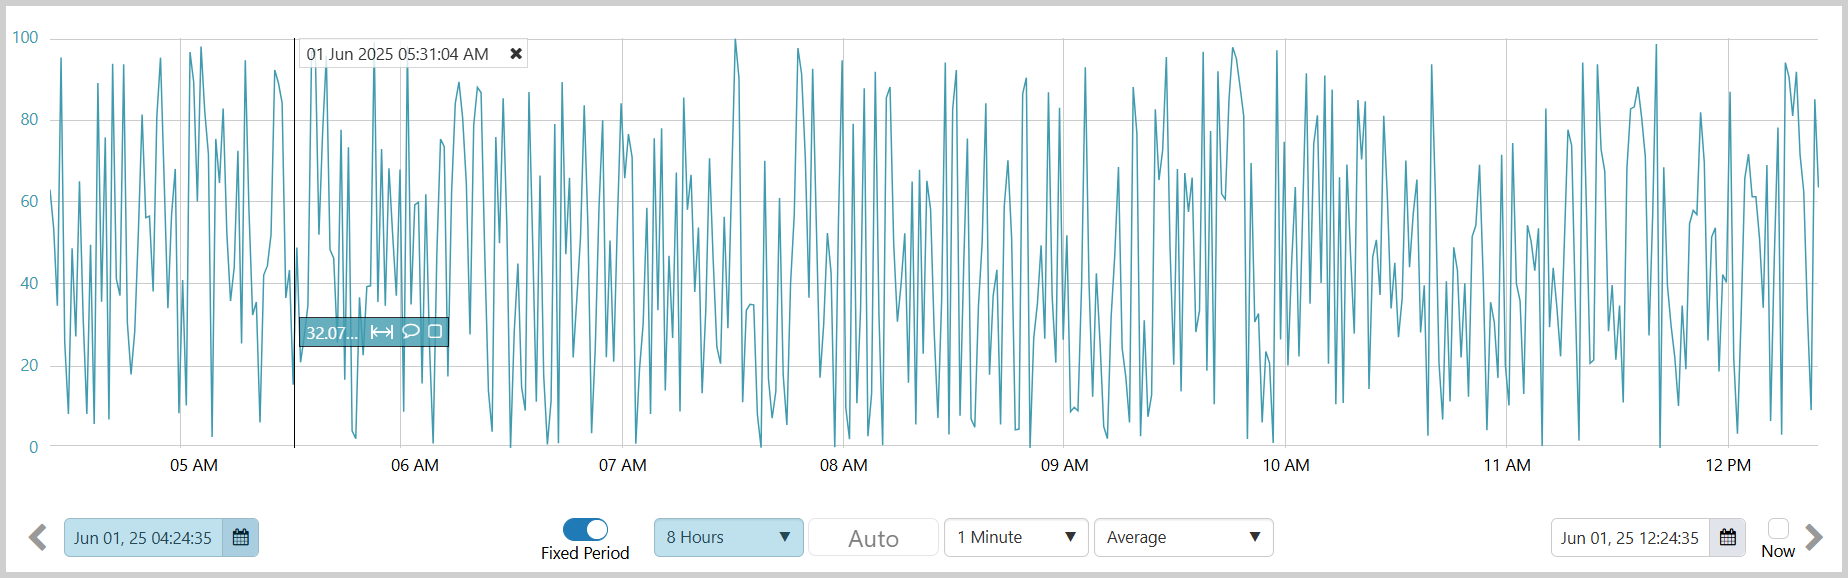
Before changing the fixed period time:
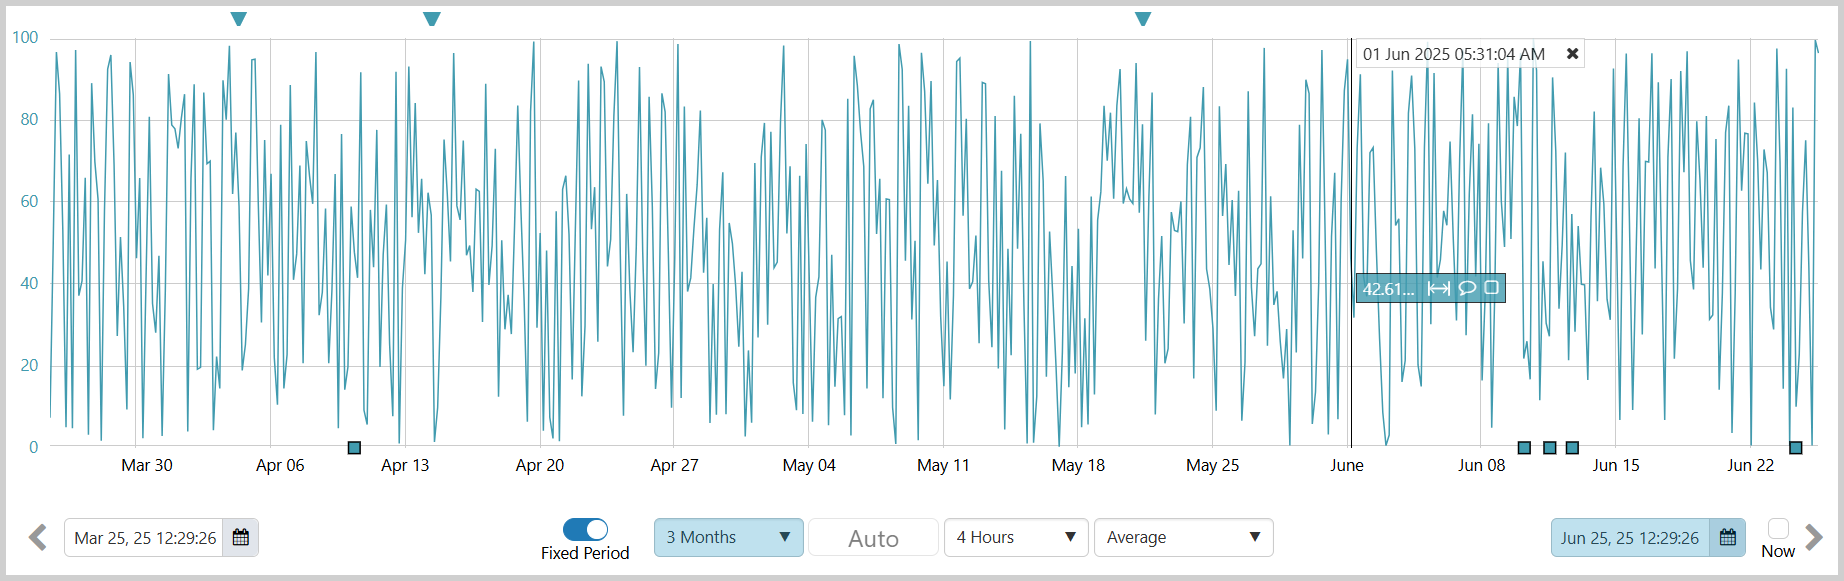
After changing the fixed period time – hairline position is unchanged, and end time is set to the current time:
Legacy Hairline
Administrators can enable the legacy hairline, in the web.config file, for users who prefer that style.
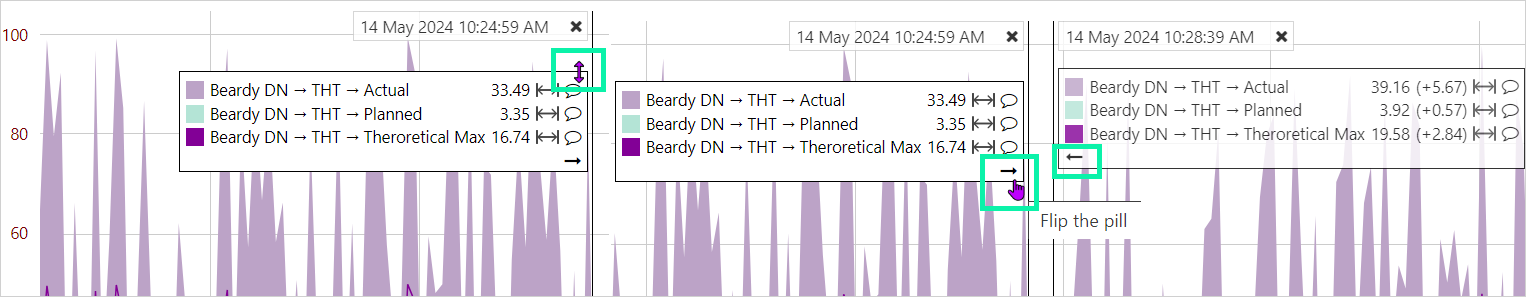
In this mode, the hairline information is shown together in one box, with the tag name always visible and displayed on the same line as the value. The order of the values follows the order of the traces.
When hovering over the information box, truncated names are fully displayed. An up/down arrow also appears to allow the box to be moved up or down along the hairline.
An arrow at the bottom of the information box allows users to flip the box to the other side of the hairline. The box will keep its position until that hairline is removed and added back. It will only reset if the hairline is closed (the x is clicked).
Configuration Note: This requires the "LegacyHairlineEnabled" option in the web.config file to be set. See Configuration File for details.
This setting affects hairlines for all users, and in all chart components, embedded trends, and trends.
Release History
- Hairlines 4.18
- Create a case from a trend
- Hairline behavior when fixed period extends beyond current time
- Trace name on hairline pill
- Hairline display options in Trends, Embedded Trends and Charts
- Hairlines 4.16
- Legacy hairline pill
- Hairlines 4.12
- Name on hairline pill
- Hairlines 4.9
- Hairlines 4.6.2
- Hairlines 4.5.5
How does one set a hairline to an exact time date or set up the snap values