ON THIS PAGE:
The hairline allows you to see the data values on a chart or trend, at a particular point in time.
Hairline Features
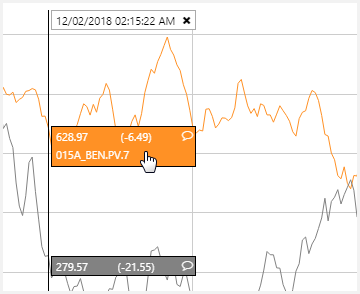
The hairline shows:
- The timestamp of the data point
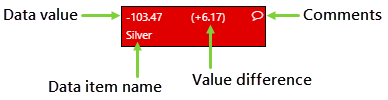
- The current value of the trace or series
- The name of the trace or series
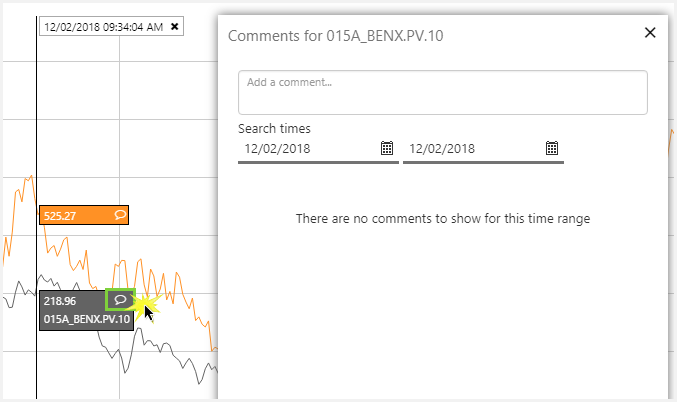
- Comments (if enabled)
- The difference between hairline values (for two or more hairlines)
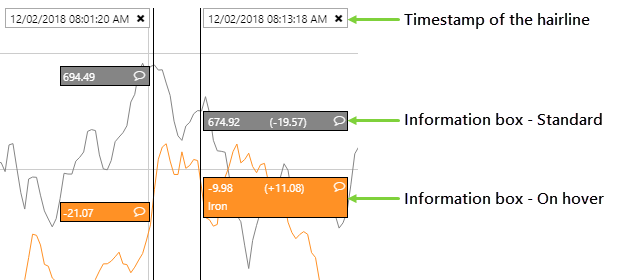
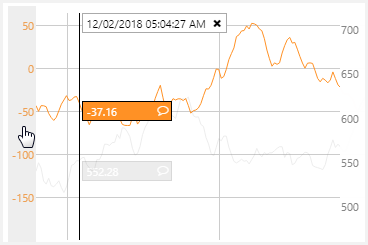
The information box is coloured to match the colour of the trace/series.
Initially, the information box shows only 3 items: the data value, the value difference, and the comment icon.
Note: The Value Difference is only displayed when there are two or more hairlines.
When you hover over the box, it expands to show the name of the data item.
Hairline Behaviour
- For dot series, interpolation for values in hairlines is Last Known Value.
- If a series/trace contains no value (or a null value), the information box will not appear.
- The comment icon is only visible when comments have been enabled in the chart or trend.
Interacting with a Hairline
Add a hairline
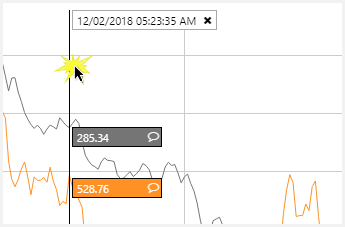
- Click on a hairline-enabled chart or trend. The hairline is added where you click.
Hover
- Hover over a data item's information box to see more information on the data item.
Select an axis
- When both Y Axes are enabled, hovering over one of the axes causes the hairline on the non-selected axis to fade.
Add comments
- Click the comment
 icon to add a view or add comments for the data item.
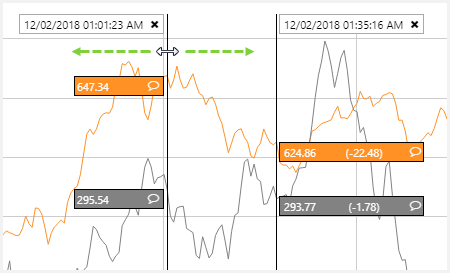
Move a hairline
- To move a hairline left or right, click the hairline and drag it to the left or right.
- When you move hairlines so that they approach each other, the information box flips so that the values are not obscured.
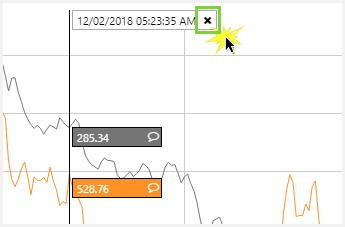
Close a hairline
- Click the Close
 button at the end of the timestamp box.