ON THIS PAGE:
The Embedded Trend component is used to embed a simplified trend within an Explorer page, and is used for quick and simple diagnostics of time series data.
With an embedded trend, you can:
- Drag and drop time series data labels from the page onto the embedded trend.
- Drag and drop tags and attributes from the Navigators onto the embedded trend.
- Add hairlines to see more detailed information.
- Add comments to tags at a point in time.
- Right-click on the embedded trend to open a full Trend display.
Identifying an Embedded Trend
The embedded trend can be configured to show trace items on the trend, or it can be empty when the page is loaded.
|
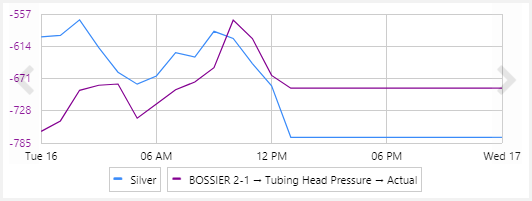
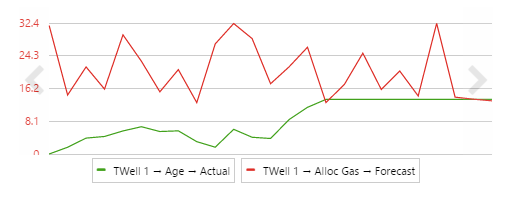
With trace items configured during page design:
|
Without pre-configured trace items:
|

Here are some examples of how the embedded trend can appear on a page, depending on how it was configured during page design.
|
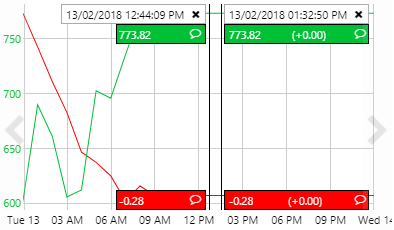
Configured for Dual Hairlines
|
|
|
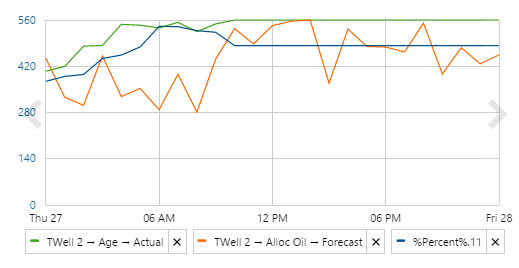
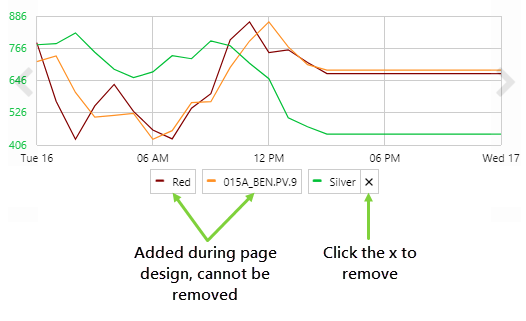
Legend
Note: Tags added during page design appear in the legend in the order they were added to the component. Tags that are added in display mode appear at the end of the legend items. |
No Legend
|
|
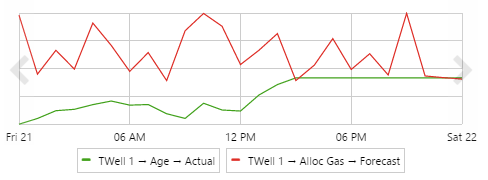
No X-Axis
|
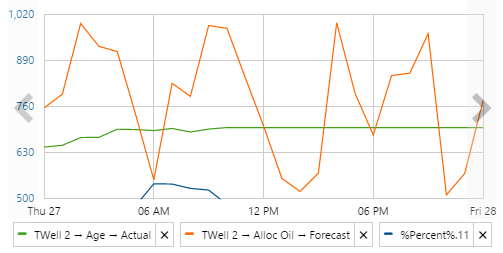
No Y-Axis
|
|
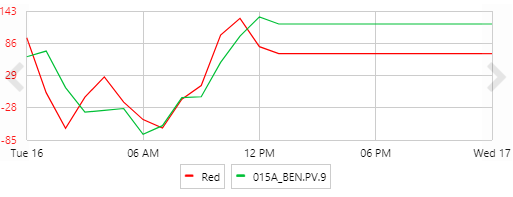
With Auto Range
|
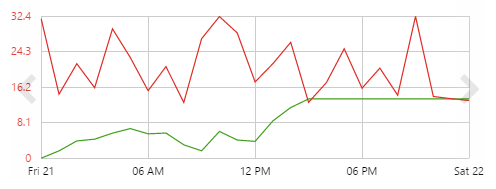
Without Auto Range
|
Adding Values
You can add time series data to an embedded trend from a data label on the same page or a different page, from the Tags Navigator, or from the Hierarchy Navigator.
You can drag and drop attributes from the Attribute Panel (accessed via the Hierarchy Navigator) and tags from the Tags Navigator onto the embedded trend.
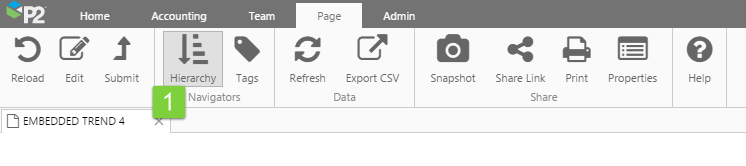
1. On the Page ribbon tab, click Hierarchy to open the Hierarchy Navigator.
2. Select a hierarchy, and then select an entity.
3. Open the Attributes Panel, by clicking Show Attributes (the label changes to Hide Attributes).
4. Hover over the page you want to add to, to give it focus.
5. Drag and drop an attribute value onto the embedded trend.
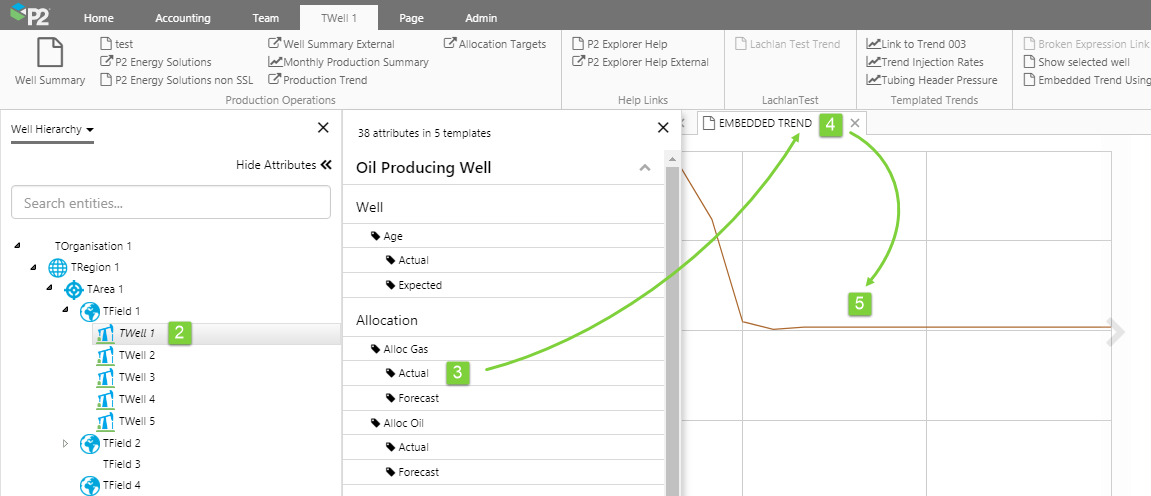
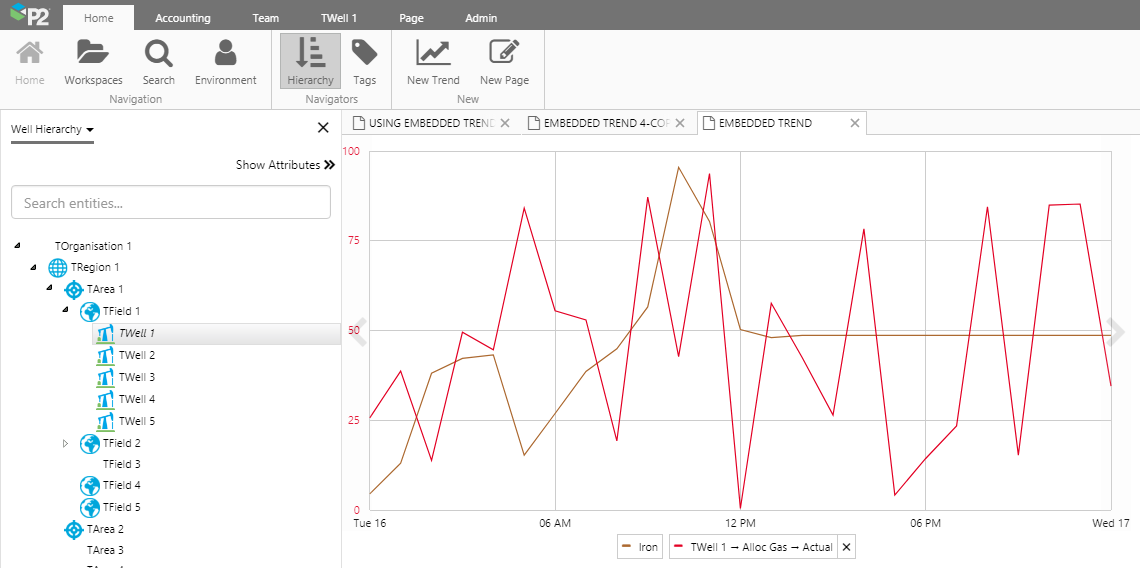
The attribute panel closes, and the attribute value appears on the embedded trend.
Using the same method, you can also add a tag: open the Tags Navigator, search for a tag, hover to give a page focus, then drag and drop the tag onto the embedded trend.
From Data Labels
You can add a data label's value onto the embedded trend, if the value is a tag or an attribute.
Simply drag and drop the data label onto the embedded trend, and the value is added as a trace line:
Removing Values
If the legend is shown, you can remove a value from an embedded trend by clicking the little X icon that is displayed next to values that may be removed.
Note: Values added during page design are unable to be removed, and do not show the remove icon.
To remove all added data, click Reload on the Page ribbon tab.
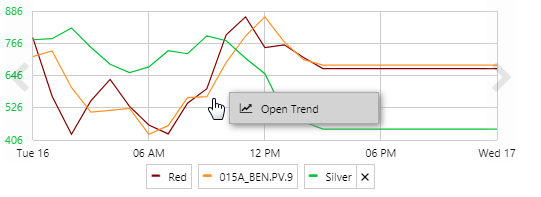
Opening a Full Trend
To open a full trend from the embedded trend, right-click on the embedded trend, and then click Open Trend.
All of the traces on the embedded trend will appear in a New Trend tab.
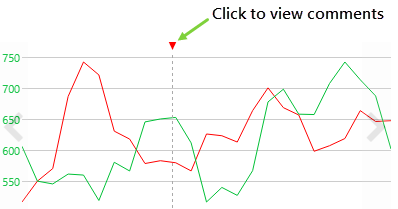
Comments
A comment icon will appear on the embedded trend if the trace items have comments against them, during the time range along the x-axis.
To view the comments at a point in time, click the comments icon at the top of the trend. The comments will appear in a window on the right of the page.
Comments for a specific trace item can also be accessed from a hairline, if this is enabled (see below).
Hairlines
If the embedded trend has been configured to add hairlines, you can add as many hairlines as the configuration allows.
The hairline shows the timestamp of the data point, the current value of the traces, the names of the traces, and allows you to view and add comments.
- To add a hairline, click a point on the trace.
- To view the comments for a trace item, click the relevant comment icon in the information box.
Selecting a Y-Axis
The embedded trend uses a single y-axis on the left, which changes colour to reflect the trace that has been selected. Each trace item is plotted against its own y-axis, but only one axis is displayed.
To show the y-axis for a specific trace item, click the legend for that item.
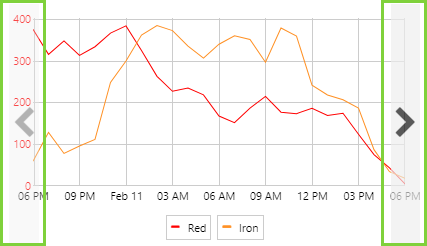
Changing the Time Range
The time range on an embedded trend is displayed along the x-axis.
To change the time range, hover over the embedded trend and click the left or right arrow, to move to an earlier time range (left) or a later time range (right).
Depending on your page configuration, the embedded trend may also be set up to use time pickers to control the start and end of the time range.
Changing the Sample Interval and Sample Method
You can only change the sample interval and the sample method if the embedded trend is configured to work with interactive controls, such as a combo box.
Note: The shorter your sample interval (for example 5 seconds) the more data required, potentially affecting performance. The Raw sample method will usually return the highest number of data points, which also potentially affects performance.
Release History
- Using an Embedded Trend 4.5.5 (this release)
- Hairline format has changed.
- Comments indicator has changed.
- Values added during page design appear in the legend in the order they were added to the component. Values that are added in display mode appear at the end of the legend items.
- Using an Embedded Trend 4.5.4
- You can now drag a data label from another page onto the embedded trend
- Labels for ad hoc calculations can be dragged onto an embedded trend (as well as for Tags and Attributes)
- Using an Embedded Trend 4.5.0