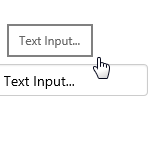
The Text Input control is available for you to type a value (number or text) which is used to update a variable. This variable is used elsewhere on the page, often to filter a dataset query that populates a data table or chart.
Read more

The IFS OI Explorer Ribbon is the main way to access the functionality of IFS OI Explorer. Find out where you can add a new page or trend, how to search for tags or trends, and more.
Read more

This page describes how to launch IFS OI Explorer and log in.
Read more
This page describes how to launch P2 Explorer and log in.
Read more
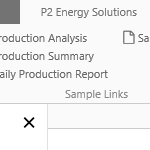
In IFS OI Explorer, the table of contents is a ribbon tab containing specific links to pages, trends, and external sites, that appears when you click on an entity in the Hierarchy Navigator.
Read more
IFS OI Explorer (previously known as P2 Explorer) is a front-end application, for displaying IFS OI Server's data in various formats on pages and trends.
This article discusses some of the ways that Administrators, Page Designers, and Users will use Explorer.
Read more

This page answers frequently asked questions about configuring charts in Explorer Studio.
Read more
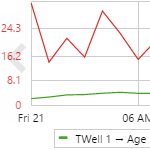
Learn how to add data to an embedded trend on an Explorer page, and how to manipulate the embedded trend.
Read more
The Calculation Tester is a fully-featured tool that allows you to test the results of your calculation. This article describes how to use it.
Read more

The Calculation Tester is a fully-featured tool that allows you to test the results of your calculation. This article describes how to use it.
Read more