Trend Controls (4.5.5)
The selections you make on the Trend Controls affect the time range of the chart, as well as the data collection method and interval.
Information on something, designed to increase general understanding of that thing.
The selections you make on the Trend Controls affect the time range of the chart, as well as the data collection method and interval.
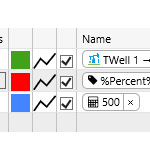
The trace table displays each trace item. You can add up to 20 traces to a trend. You can configure your trace items by updating the table, and you can add or remove trace items in the table.
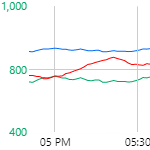
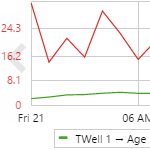
Data is plotted in the trace window, along an X and one or two Y-Axes (left and right). This article describes the features of the trace window.
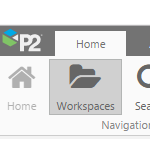
The P2 Explorer Ribbon is the main way to access the functionality of P2 Explorer. Find out where you can add a new page or trend, how to search for tags or trends, and more.
This page answers frequently asked questions about how to use P2 Explorer.
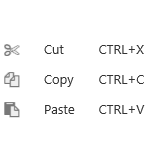
This collection of shortcuts and tips applies to Explorer.
The Point Detail page shows various details and links for a tag or an attribute value. See how to open the two Point Detail pages: Attribute Value Detail and Tag Detail.
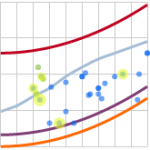
The Performance Curve draws curves defined by representative formulas, and then draws an X-Y plot of real, correlated data over these curves. Read about how to use the Performance Curve.
This page answers frequently asked questions about configuring charts in Explorer Studio.
Learn how to add data to an embedded trend on an Explorer page, and how to manipulate the embedded trend.