ON THIS PAGE:
Overview
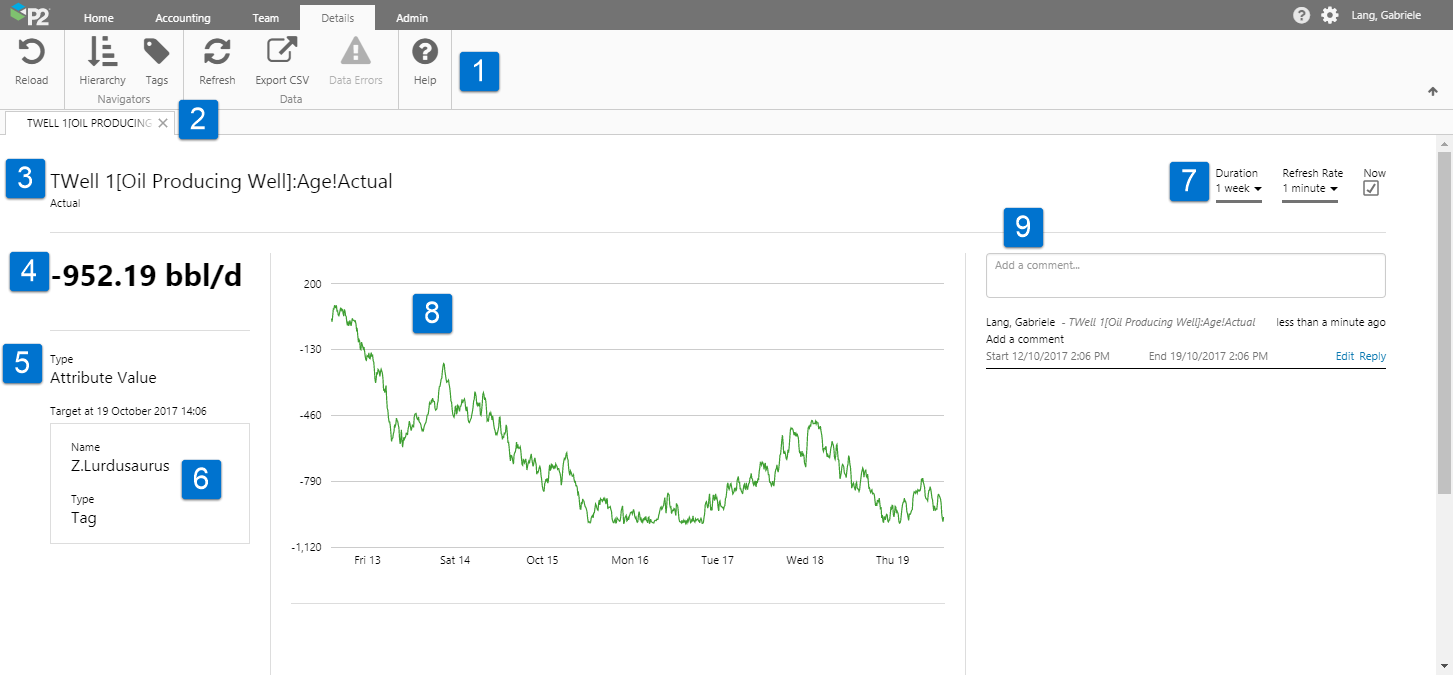
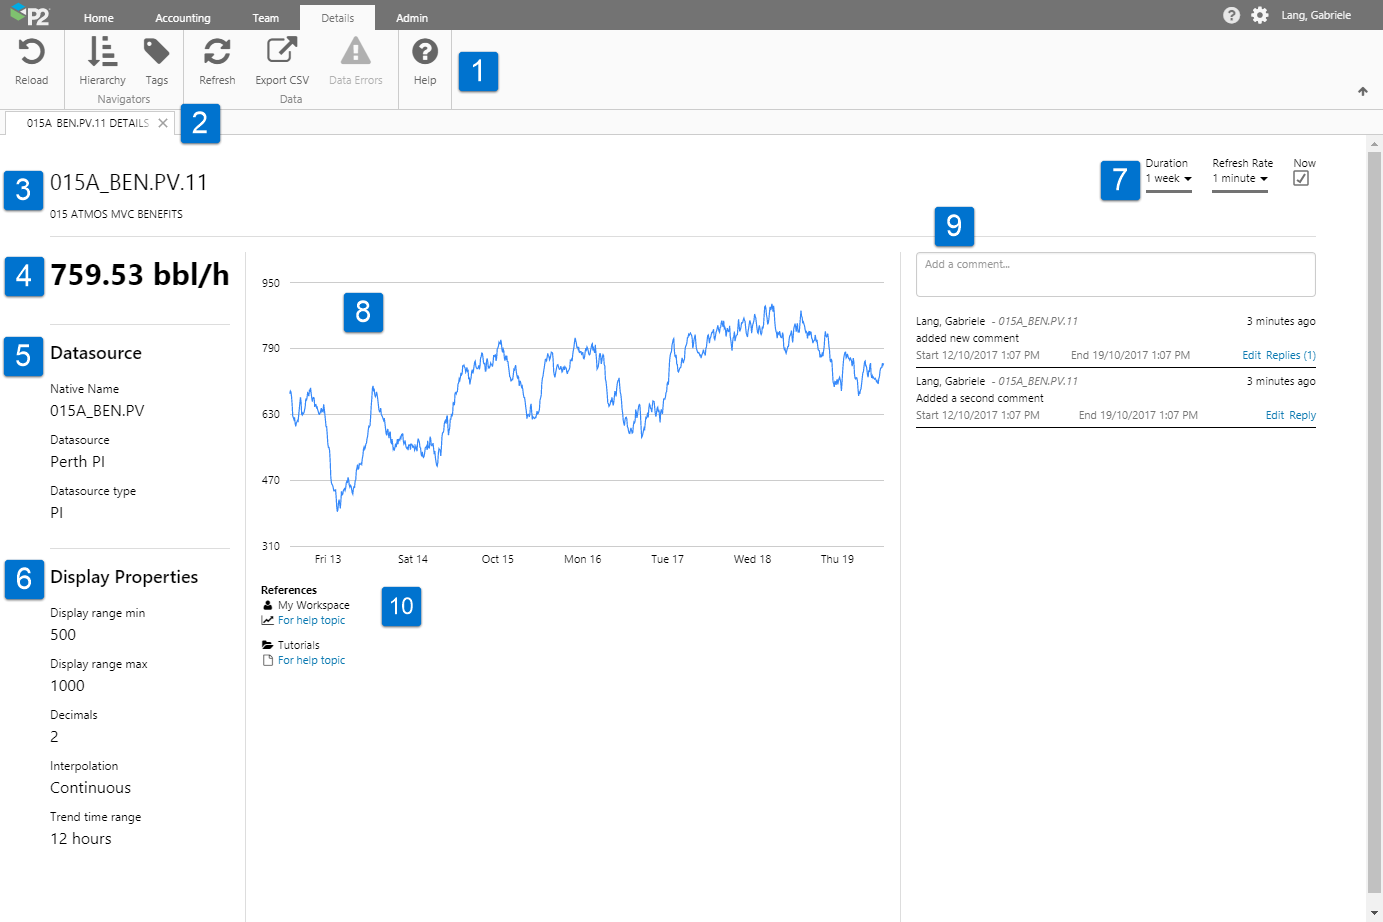
The Point Detail page shows various details, links, comments, and a simple trend for a tag, calculation, or attribute value.
Opening a Point Detail Tab
You can open the Point Detail for an attribute value from a control on an Explorer Page, such as a Data Label, or from the Attribute Panel for an entity, accessed from the Hierarchy Navigator.
You can open the Point Detail for a tag (including a calculation tag) from a control on an Explorer Page, such as a Data Label, from a tag in the Tags Navigator, from a Search Page, or from an Attribute Value's Point Detail page (if the attribute value's value is a tag).
Page Controls Right-click Menu
Many of the page controls have a menu for the main data item of the component (for example, the measured value in a temperature meter, or the actual value in a status indicator).
- If the main data item is an attribute value, you have the option to view the attribute value's Point Detail.
- If the main data item is a tag, you have the option to view the tag's Point Detail.
For example, you can view the Point Detail for the level measurement, in this Level Meter:
Here is the full list of page controls that have the right-click menu:
| Data Label | Chart | Bullet Graph | Target Variance Bar, Target Label and Target Bar |
| Meters | Wind Vane | Tank | Status Tile and Status Indicator |
Point Detail for an Attribute Value
You can open the Point Detail for an attribute value from two places:
Opening Point Detail from a Page Control
Several of the page controls have a link to the Point Detail page. If the data is an attribute value, you can open its Point Detail.
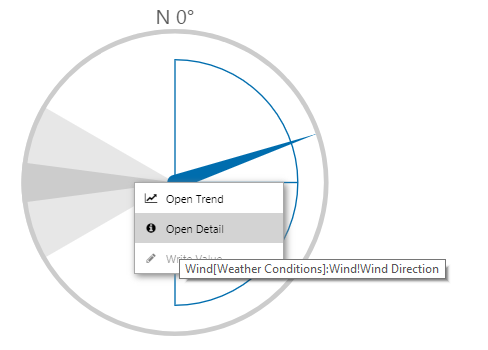
Right-click on the page control, to open the menu. Hover over the menu to see the fully-qualified attribute value name.
Click Open Detail to open the attribute value's Point Detail page in a new Explorer tab.
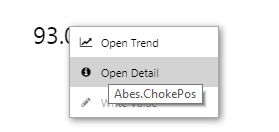
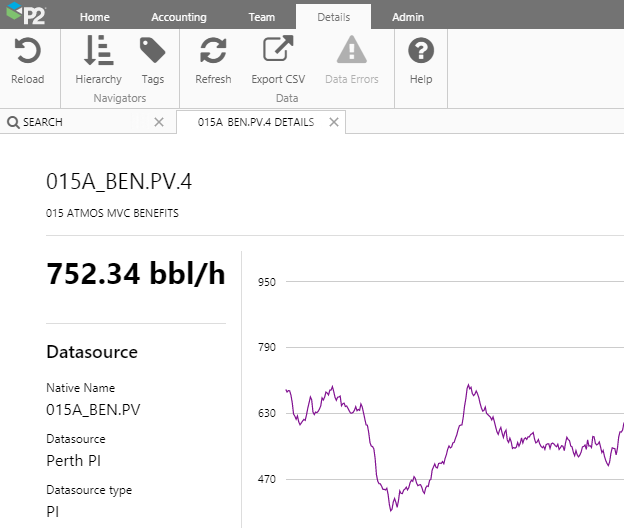
The following screenshots show examples of some of the page controls that use an attribute value as their displayed or measured data. Each of these has a right-click menu with an Open Detail option.
| A data label displaying an attribute value. Right-click and select Open Detail. |
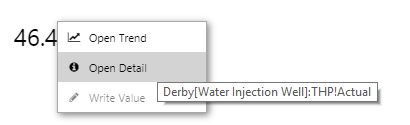 |
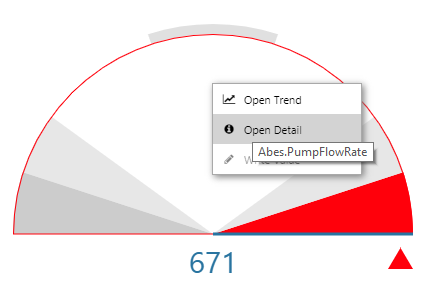
| A gauge measuring an attribute value. Right-click and select Open Detail. |
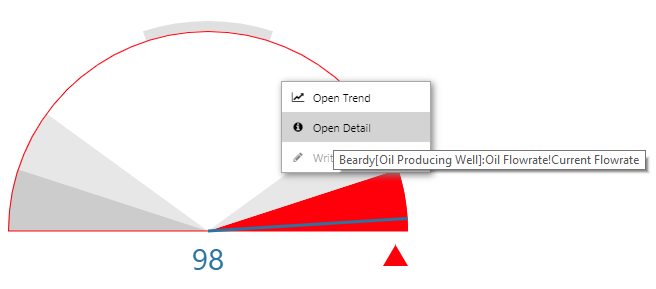 |
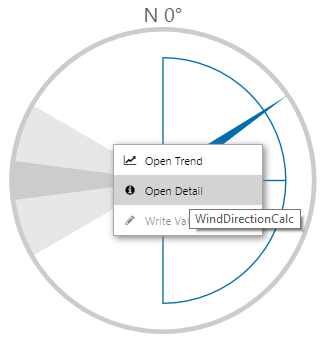
| A wind vane displaying an attribute value for wind direction. Right-click and select Open Detail. |
 |
Opening Point Detail from the Attributes Panel
Entities that have been organised into a hierarchy in P2 Server can be located using the Hierarchy Navigator.
1. Open the Hierarchy Navigator (click the Hierarchy button on the Home ribbon tab).
2. Locate an entity in the Tags Navigator (select a hierarchy, then type in some search text, or navigate through the hierarchy to find your entity).
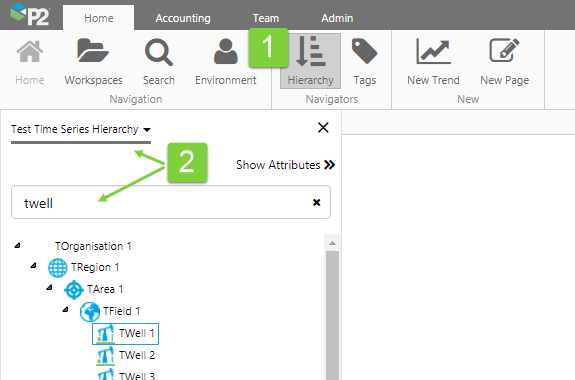
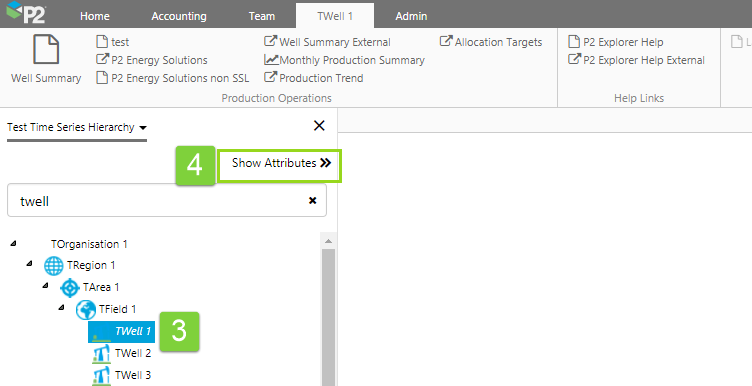
3. Click on the entity.
4. Click Show Attributes to open the Attributes Panel, which displays attributes (if any) for the selected entity.
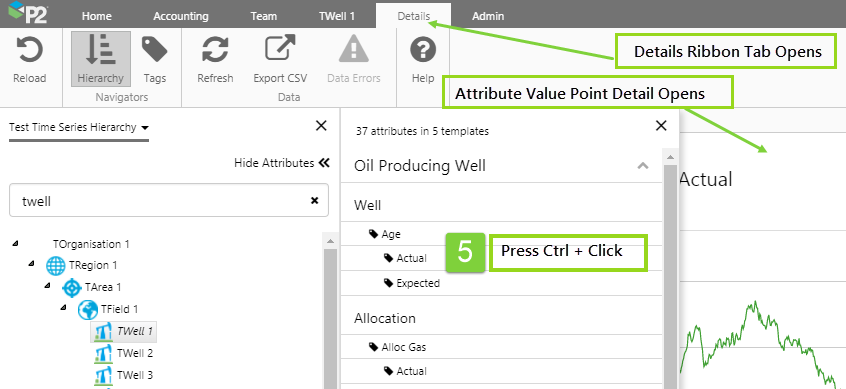
5. On the Attributes Panel, press Ctrl and click on an attribute or attribute value.
The Attribute Value Point Detail opens in a new Explorer tab for the attribute value (or for the default attribute value if you just selected the attribute), and the Explorer Details ribbon tab appears.
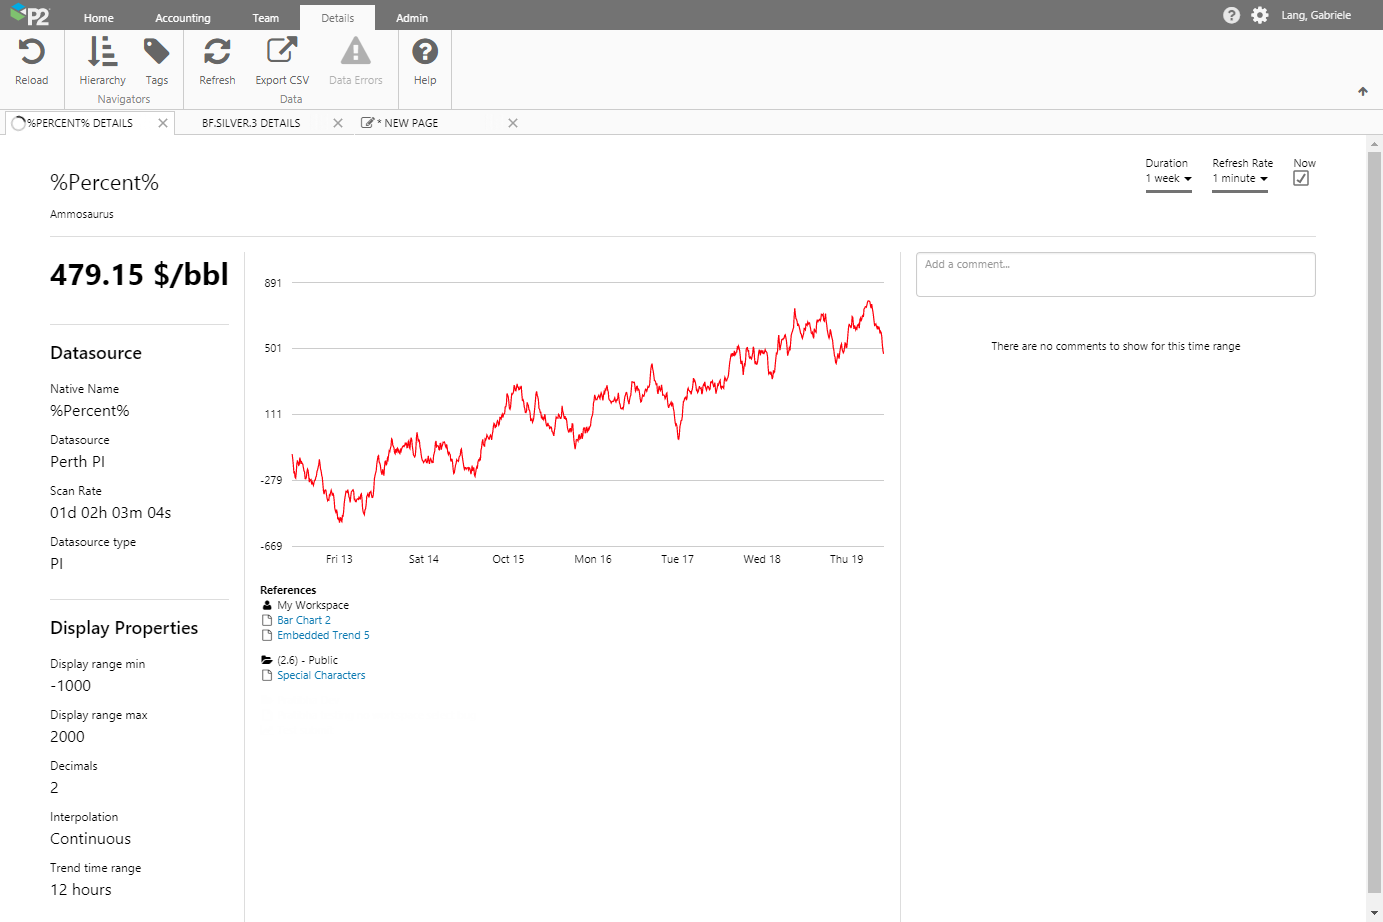
Features of Attribute Value Details
The Attribute Value Detail page displays the following:
|
|
Point Detail for a Tag
You can open the Point Detail for a tag from various places:
- Open from a Page Control
- Open from the Tags Navigator
- Open from the Search Page
- Open from an Attribute Value's Point Detail
Opening Point Detail from a Page Control
Several of the page controls have a link to the Point Detail page. If the data is a tag, you can open its Point Detail.
Right-click on the page control, to open the menu. Hover over the menu to see the tag name.
Click Open Detail to open the tag's Point Detail page in a new Explorer tab.
The following screenshots show examples of some of the page controls that use a tag as their displayed or measured data. Each of these has a right-click menu with an Open Detail option.
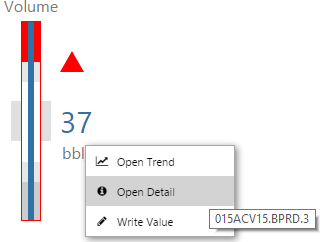
| A data label displaying a tag. Right-click and select Open Detail. |
 |
| A gauge measuring a tag. Right-click and select Open Detail. |
 |
| A wind vane displaying a tag for wind direction. Right-click and select Open Detail. |
 |
A flat list of tags can be located in the Tags Navigator.
1. Open the Tags Navigator (click the Tags button on the Home ribbon tab).
2. Locate a tag in the Tags Navigator.
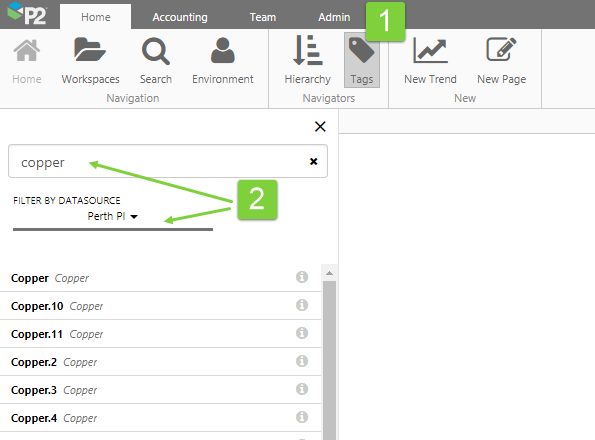
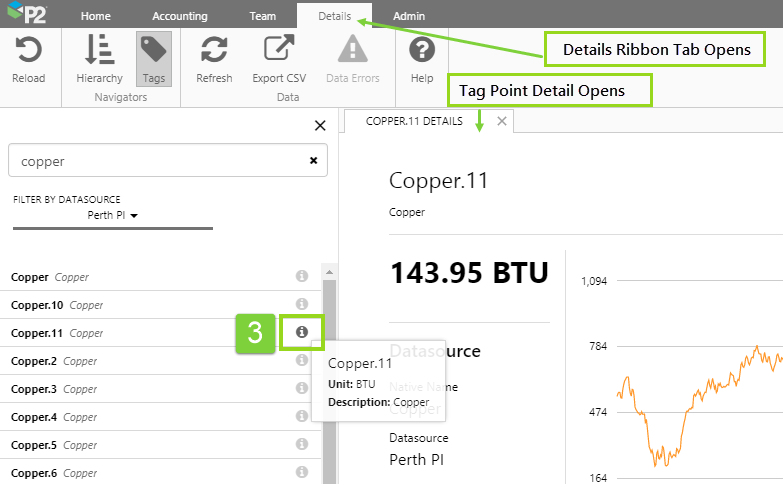
3. Click the information ![]() icon to open the Tag Details page.
icon to open the Tag Details page.
The Tag Point Detail opens in a new Explorer tab for the tag, and the Explorer Details ribbon tab appears.
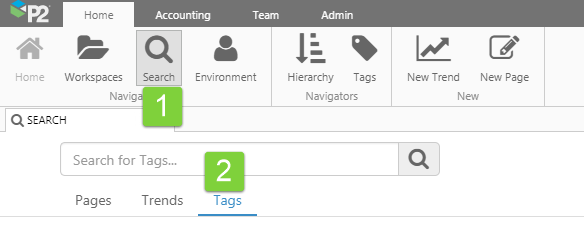
Opening Point Detail from the Search Page
The Search page gives you the option to search pages and trends by name, as well as tags by name and description.
1. Click Search on the Home ribbon tab.
2. Click the Tags tab button.
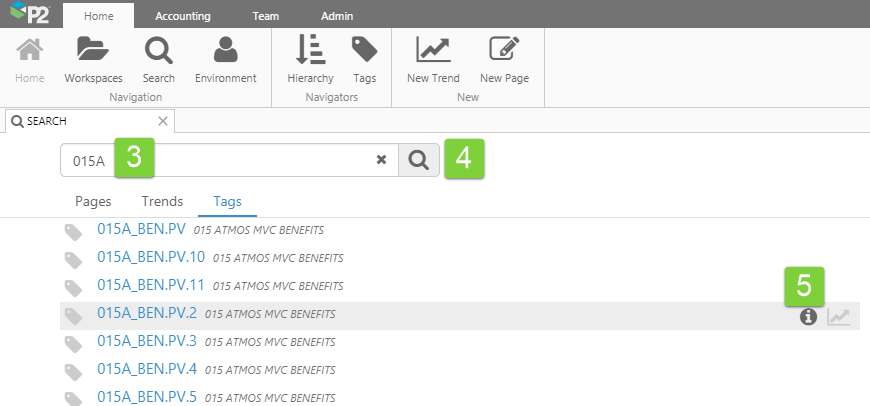
3. Type part of a tag name or description in the Search box.
4. Press Enter or click the Search ![]() button.
button.
5. Hover over a tag and click the information ![]() icon to open the Tag Details page.
icon to open the Tag Details page.
The Tag Point Detail opens in a new Explorer tab for the tag value.
Opening Point Detail from an Attribute Value's Point Detail
You can open the Point Detail for a tag from an Attribute Value's Point Detail page, if the attribute value's value is a tag.
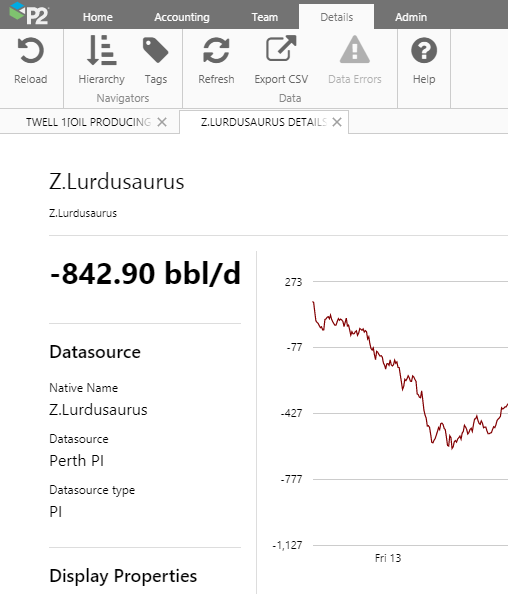
Click the hyperlink for the tag name, in an Attribute Value's Point Detail, where the type is Tag.
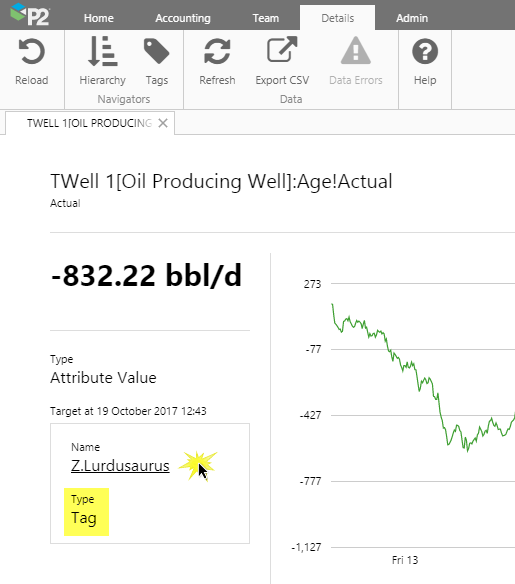
The Tag Point Detail opens in a new Explorer tab for the tag value.
Features of Tag Point Detail
The Tag Point Detail page displays the following:
|
|
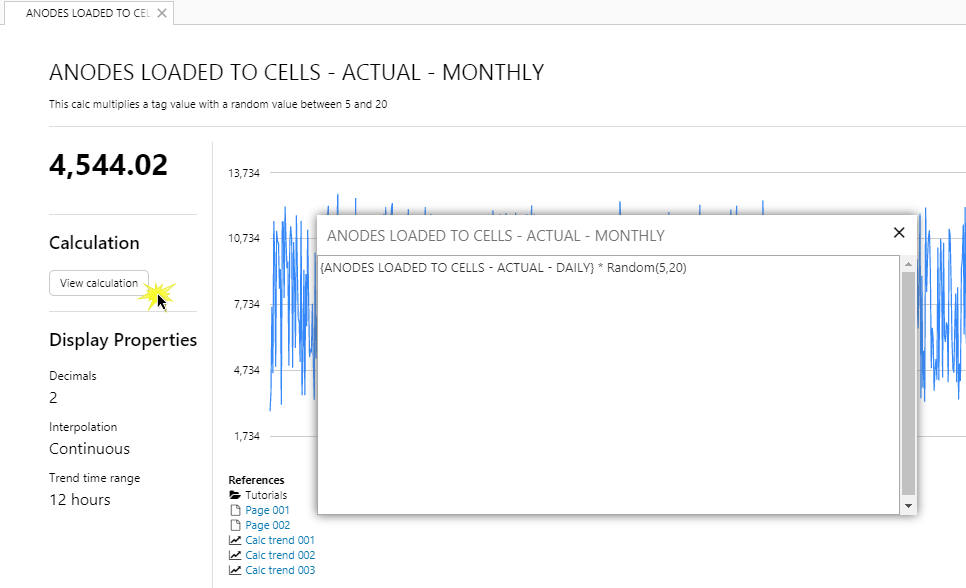
Calculation Detail
Open the Point Detail page for a calculation, from the Tags Navigator, Search Page, or from a page control's right-click menu. To view the calculation window, click View calculation on the Point Details page for the calculation.
Release History
- Point Detail 4.5.3 (this release)
- The point detail (when opened from a page control, such as a chart) opens with its end time defaulted to Now, with a one week duration.
- The sample interval that is used in the trend now adapts automatically to suit the selected duration, providing a better resolution of the trend. For example, a 2 years duration might use a 12 hours sample interval, while a 30 minutes duration might use a 10 seconds sample interval.
- New Details ribbon tab, which opens for a Point Details page
- Point Detail (4.4.5)
- The Display Properties of a tag appear on the Tag Details page. These details are stored in the tag definition in P2 Server.
- Calculation details, opened from a Tag Details page, are displayed in a pop-up window that remains open even when the Tag Details page is closed.
- References to pages and trends have a larger area now, below the trend, and are grouped into columns. Scrollbars appear if the list of referenced items exceeds the allocated area.
- If units are allocated to a tag, then these appear with the tag value.
- Point Detail (4.4)