Using Comments (4.4)

Field Operator comments and their threaded responses, make an effective shift handover log. This page shows you how to add a new comment, and how to reply to, edit or delete existing comments.
Information on something, designed to increase general understanding of that thing.
Field Operator comments and their threaded responses, make an effective shift handover log. This page shows you how to add a new comment, and how to reply to, edit or delete existing comments.
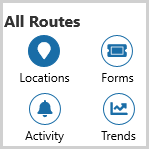
How to navigate Field Operator, and what the different buttons do.
An overview of the P2 Explorer interface.

A data mart is a connection between Shift Log and a predefined Microsoft SQL Server database. The datamart works by enabling shift log entries to be written to tables in the database. External queries can be written to extract Shift Log data from the database, in a format that is easy to use in other systems such as Power BI or SSRS.
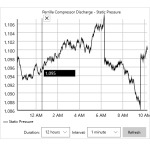
In Field Operator, trends can be used to view real-time diagnostic data from IFS OI Explorer.
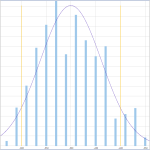
The Histogram component allows page designers to plot sets of normalized data and generate a bell curve. The component also provides a range of statistical features in a separate panel, which can be hidden if required.
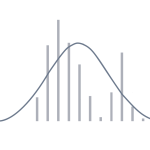
The Histogram is similar to a bar chart except it groups normalized data into multiple ranges, with each bar representing one range. The fit of the bell curve to the histogram gives an indication of how well the data matches a normal distribution curve.
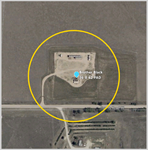
You can setup Field Operator to automatically show the data entry form, or task for an entity. This is called Location Awareness, and it can be activated by using the GeoFence function.
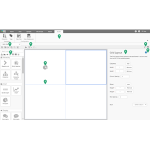
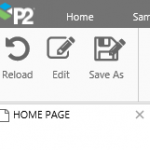
Studio is your design interface for building Explorer pages. Click through this interactive tour to learn about P2 Explorer Studio.
Learn about IFS OI Explorer Studio, your design interface for building Explorer pages.