Gauge
The gauge shows a numeric value as a needle in relation to target areas. Its appearance changes when limits/alarm thresholds are exceeded.
This article applies to Version 4.4.2 and later of IFS OI Explorer.
The gauge shows a numeric value as a needle in relation to target areas. Its appearance changes when limits/alarm thresholds are exceeded.
This article applies to Version 4.4.2 and later of IFS OI Explorer.
Tags and attributes values can be added to trends or viewed on pages, with or without calculations, to help you diagnose problems and visualise value changes over time.
This article shows you how to navigate or search for entities from a selected hierarchy, and then select attributes, as well as how to search for tags. The article also describes what you can do with tags and attribute values.
IFS OI Server stores icons used in hierarchies and images for IFS OI Explorer. This article explains how to add images using IFS OI Server Management and the Import/Export spreadsheet.
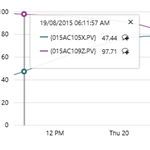
An Explorer trend displays time-series data, such as tags and attributes, over a selected period.
The trend can have multiple hairlines, and you can add comments to the trended tag or attribute.
See how to add and view trends, and how to use the calculation editor within the trend.

How to publish a page or trend you have built so that other people can see it.
This article describes how to move, rename, and delete pages in P2 Explorer, as well as how to save copies of a page.
The Table Layout is a component that arranges your data in a tabular format. You only need to configure the first row on the table and that will be repeated across each row in your dataset.
The Table Layout is a component that arranges your data in a tabular format. You only need to configure the first row on the table and that will be repeated across each row in your dataset.
The Embedded Trend component is used to embed a smaller version of a trend within an Explorer page, and is used for quick and simple diagnostics. Read about how to configure this.
P2 Explorer charts work together with user controls to display source data interactively. There are several types of charts available, including area chart, line chart, scatter chart, bar chart, and stacked bar chart. Learn about the different types of chart series, how to configure charts to use different types of data, and how to use variables for controlling charts in display mode.