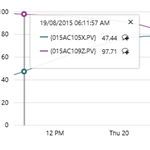
This article applies to the Trends in versions 4.5.3 to 4.5.4 of P2 Explorer. For more, see Release History. For help on the latest version, see Creating a Trend. A trend displays time-series data, such as tags, attribute values and calculations, over a selected period of time. To create a…
Read more
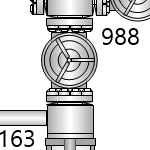
This component is used to display an image on a page. The component can be configured to show one of many different images, where the displayed image is shown when a specific condition is met. Images are often overlayed with text labels, data labels or hotspots.
This article describes how to configure an image in Explorer version 4.4.6 and later.
Read more
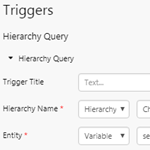
A Hierarchy Query is used to generate a list of child entities from a hierarchy, for a selected entity. This article explains how to set up the Hierarchy Query trigger in IFS OI Explorer 4.5.4 and later.
Read more
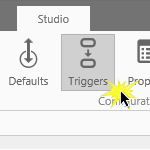
Open the Triggers panel from the Studio toolbar, to configure hierarchy queries which reveal the current selected entity's primary template name, as well as its child entities to a stipulated level, and optionally filtered to specific templates.
Read more

A hierarchy is an organised structure of entities, intended to form a model of assets within an organisation. Configuring a well-structured hierarchy is crucial to getting the most out of your asset model. This article describes how to configure a hierarchy using Server Management or the Import/Export spreadsheet.
Read more
This article describes how to use the Image Gallery in P2 Explorer.
Read more
The Bullet Graph is similar to a horizontal bar chart but allows users to compare two values in relation to one another. This article describes how to configure a bullet graph in versions 4.4.1-4.5.3 of P2 Explorer.
Read more

P2 Server stores icons used in hierarchies and images for P2 Explorer. This article explains how to add images using P2 Server Management and the Import/Export spreadsheet.
Read more

The Table Layout is a component that arranges your data in a tabular format. You only need to configure the first row on the table and that will be repeated across each row in your dataset.
Read more
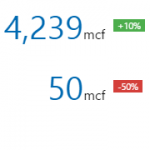
The Target Label shows two values side by side: a numeric value and a percentage of the value in relation to a target value. This article describes how to configure a target label, and applies to versions 4.3.2 and earlier of IFS OI Explorer.
Read more