This section describes the architecture and settings of the Field Operator syncing system. This system was designed to accommodate low bandwidth remote devices and tax the ProCount database as little as possible. ON THIS PAGE:Goals of the Syncing SystemData download processesData Upload ProcessSettings Controlling the Sync Processes Goals of the…
Read more

IFS OI Field Operator is an industry-leading field data capture and operations management solution with mobile capabilities that simplify a field operators’ daily challenge of managing large portfolios of wells and equipment and remote operations.
Read more
About Field Operator Field Operator, its components and prerequisite modules. Configuration Utility Instance definition and other configuration options. Sync Process Download and upload processes and other settings. Error Handling Where errors are stored and how to address them. Authentication and Authorization Setting up users and their access. Field Operator Conduit…
Read more
Sentinel 4.10.2 adds Explorer case categorization functionality and the ability to assign a token, auxiliary data, or a value to case fields.
Read more

In Field Operator you can plan, and optimize your activities for the day by using the Journey Planner. You can add entire routes, or only selected locations or cases to your journey.
Read more
In Field Operator you can plan, and optimize your activities for the day by using the Journey Planner. You can add entire routes, or only selected locations or tasks to your journey.
Read more
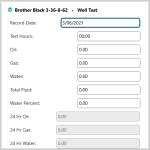
Forms are all Field Operator readings that are not Daily Readings. Run Tickets, Water Draws, Well Tests and Compressor Inspections are examples of Forms.
Read more
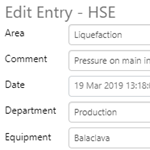
The Shift Log Entry Form ("entry form") is where you create and edit entries in Shift Log. This article describes how to open the entry form, and what you can do with the entry form.
Read more
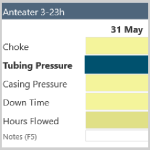
In Field Operator, Daily Readings are one of the two types of readings that can be entered. Other readings are categorized as a type of form. Daily Readings are the Daily Production data for each entity, and are expected to be entered daily.
Read more

Field Operator comments and their threaded responses, make an effective shift handover log. This page shows you how to add a new comment, and how to reply to, edit or delete existing comments.
Read more