Overview
The Dataset Table displays data in a pre-defined table format. Configuration settings allows the page designer to select the columns to be displayed by either:
- Specifying each column by name.
- Identifying a column number, and displaying all columns after that number.
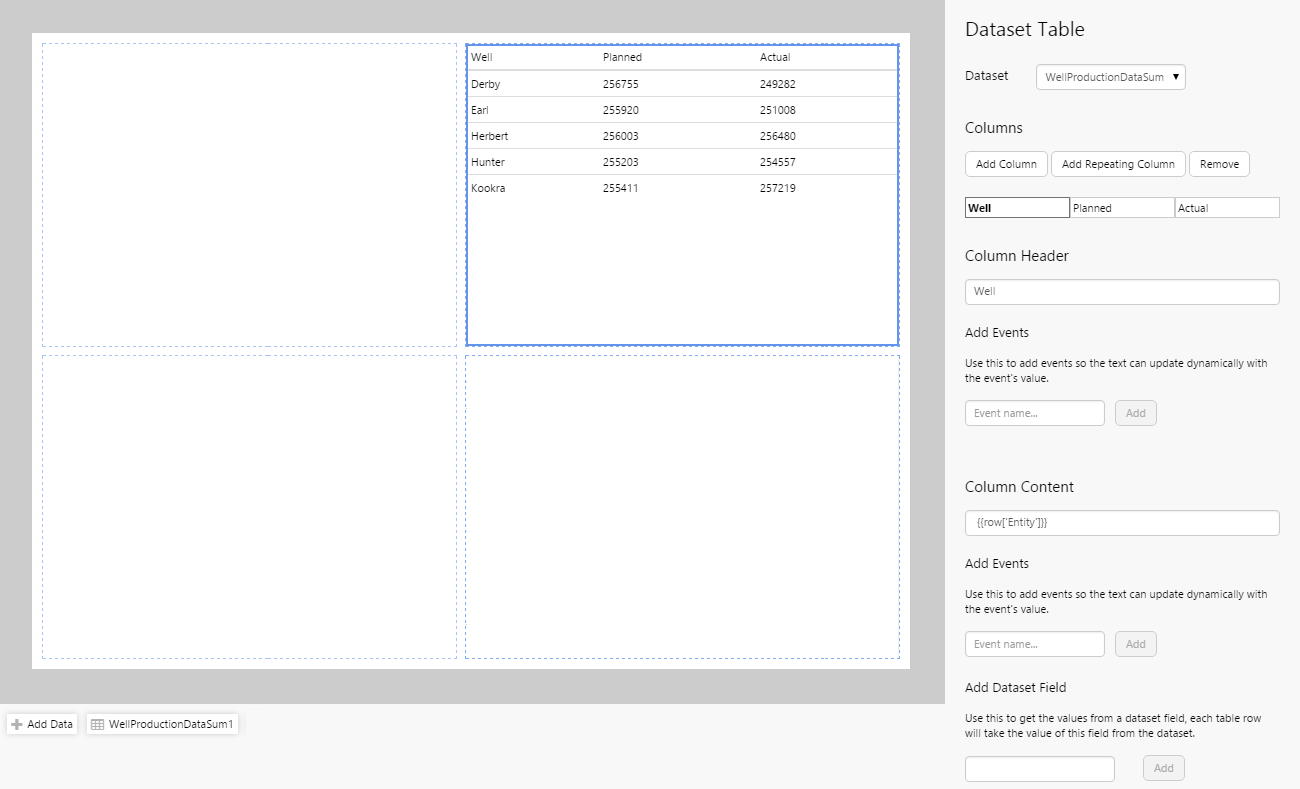
The following diagram shows a Dataset Table configured to display specific columns, identified by name, in a table:
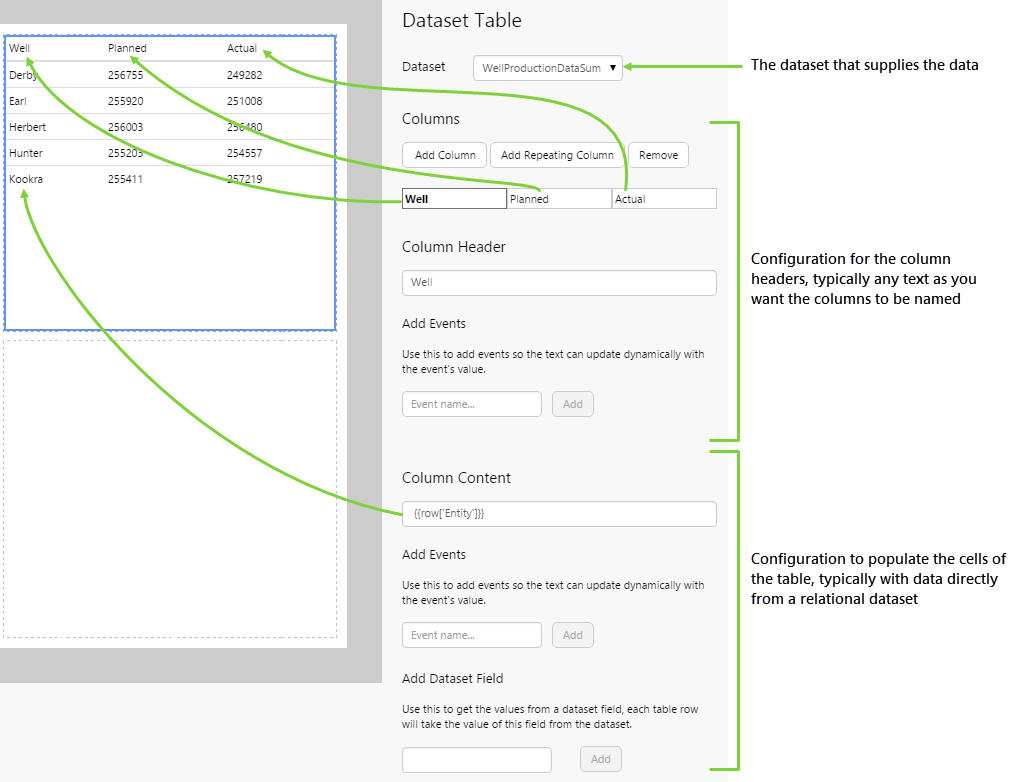
| Data Set: | The dataset from which the values are obtained. |
| Columns: | The number of columns for the table. Click "Add Column" to add more columns. |
| Column Header: | The name of the column in the table. This can be any text you want. First click the column you want to name, then type the name into this box. |
| Add Events: | You can add an event to the column header to dynamically update its value, in a similar way to adding events to a Text Label. |
| Column Content: | The values that will be displayed in a column. You can type the syntactically correct form directly in here, or use Add Events or Add Dataset Field to automatically add the correct syntax. |
| Add Events: | You can add an event to the column content to dynamically update its value. This feature is not used very often. |
| Add Dataset Field: | The name of the column in the dataset to use in order to populate this column of the Dataset Table. |
Tutorial 1. Specifying Column Names
In this tutorial, we'll display a portion of a dataset in a table by identifying the name of the columns we want to display. Let’s go through this process, step-by-step.
Before You Start
Open a new tab in Explorer and click the “Create a New Page in Studio Mode” thumbnail. Choose the grid layout – you can adjust the rows and columns if you like but it’s not important for this exercise.
You will need to adjust the configuration to suit your data at your site.
Step 1. Add the source data
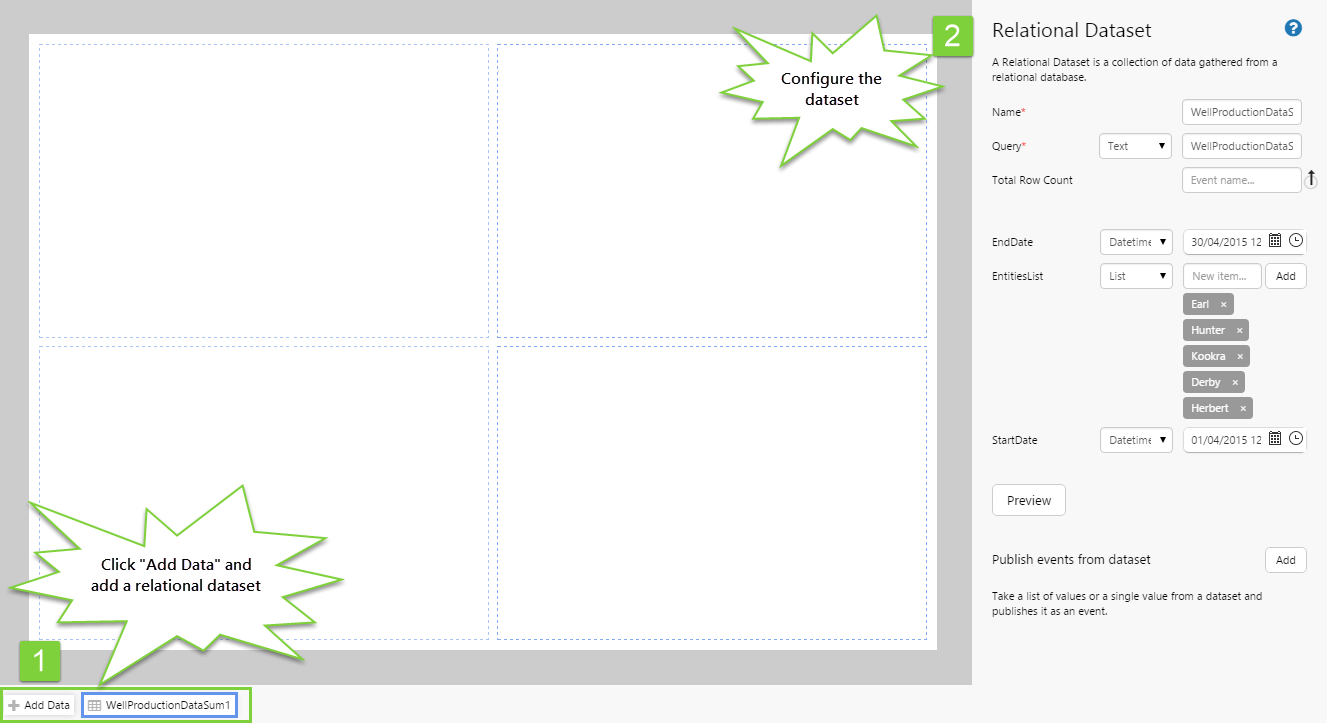
As the aim here is to display tabular data, the first thing we want to do is add the data we want to display.
- Add the WellProductionDataSum1 dataset, and configure it as follows:
- Name: WellProductionDataSum1
- Query: (Text) WellProductionDataSum
- StartDate: (Datetime) 01/04/2015 12:00:00 AM
- EndDate: (Datetime) 30/04/2015 12:00:00 AM
- EntitiesList: (List) Earl, Hunter, Kookra, Derby, Herbert
Click the Preview button and observe the columns in the dataset. You may want to leave this preview table open during Step 3.
Step 2. Add the Dataset Table component to the page
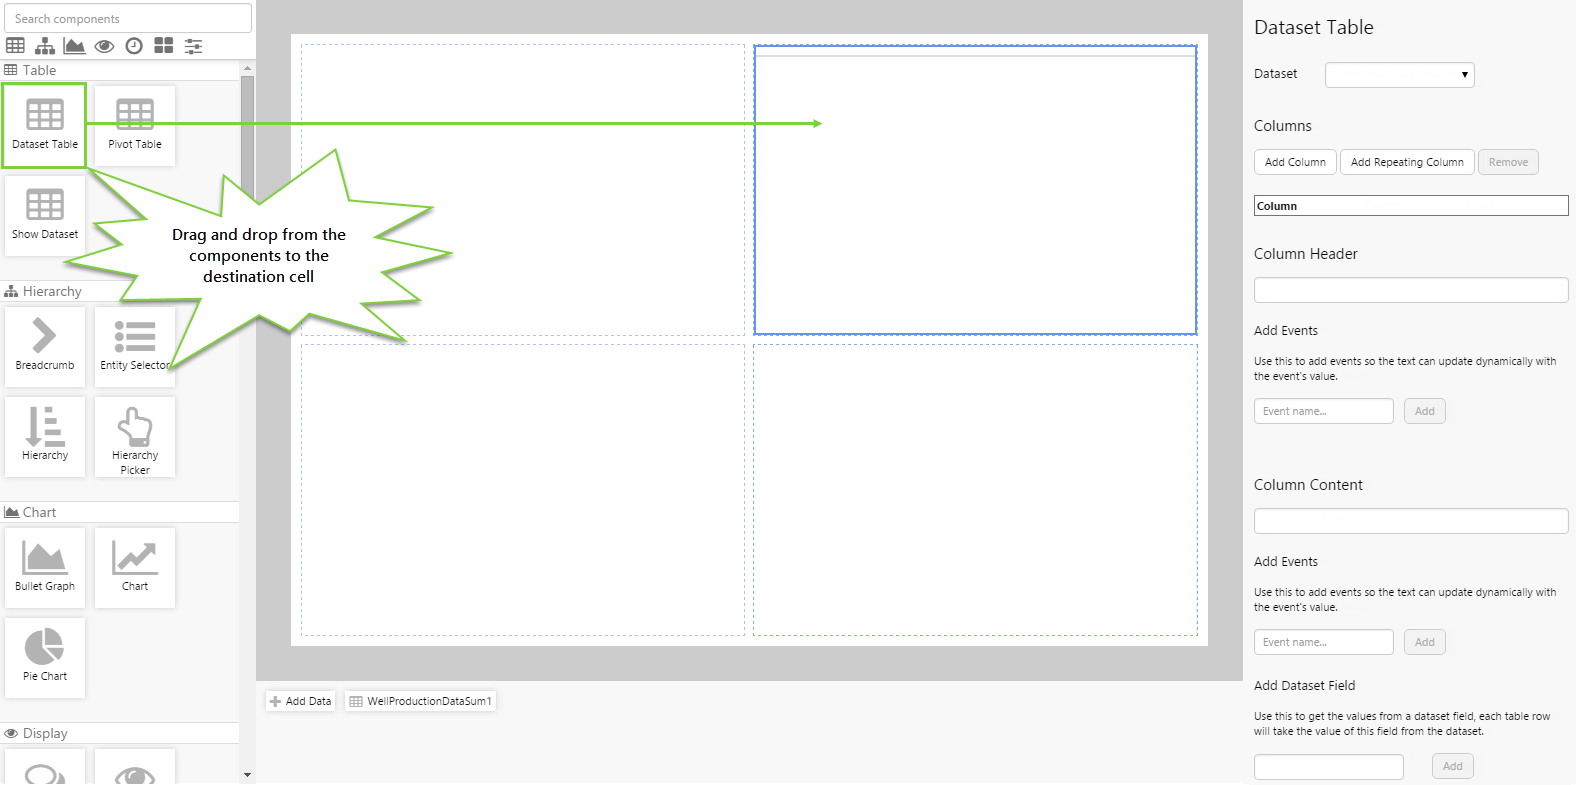
Drag and drop the Dataset Table component onto a grid cell.
Step 3. Configure the Dataset Table component
Configure the Dataset Table component as follows:
- Dataset: WellProductionDataSum1
- Columns: 1 row is added by default. Click “Add Column”twice to add 2 more columns.
- Click the first column (on the left).
- In the Column Header box, type Well.
- In the Column Content section, in the box below “Add Dataset Field”, type Entity and then click “Add”.
- You should now see the text {{row[‘Entity’]}} in the Column Content box.
- Click the second column (in the middle).
- In the Column Header box, type Planned.
- In the Column Content section, in the box below “Add Dataset Field”, type CostPlannedSum and then click “Add”.
- You should now see the text {{row[‘CostPlannedSum’]}} in the Column Content box.
- Click the third column (on the right).
- In the Column Header box, type Actual.
- In the Column Content section, in the box below “Add Dataset Field”, type CostActualSum and then click “Add”.
- You should now see the text {{row[‘CostActualSum ‘]}} in the Column Content box.
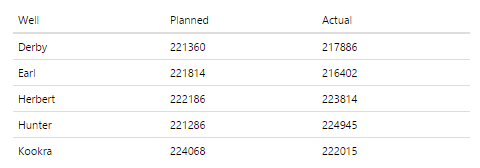
Step 4. All done!
Great work! You now have a fully functioning Dataset Table that displays 3 columns of data in a table.
- Click the preview
 button on the Studio toolbar to see what your page will look like in run-time.
![]() Don’t forget to save your page!
Don’t forget to save your page!
Tutorial 2. Identifying a Column Number
In this tutorial, we'll display a portion of a dataset in a table. But instead of specifying the columns by name, we'll provide a column number and let Explorer fill in the columns automatically. Let’s go through this process, step-by-step.
Before You Start
Let's stay on the same page you used for the first tutorial. You'll need an empty grid cell for adding another dataset table. If you don't have one available, add this now.
As before, you will need to adjust the configuration to suit your data at your site.
Step 1. Add the source data
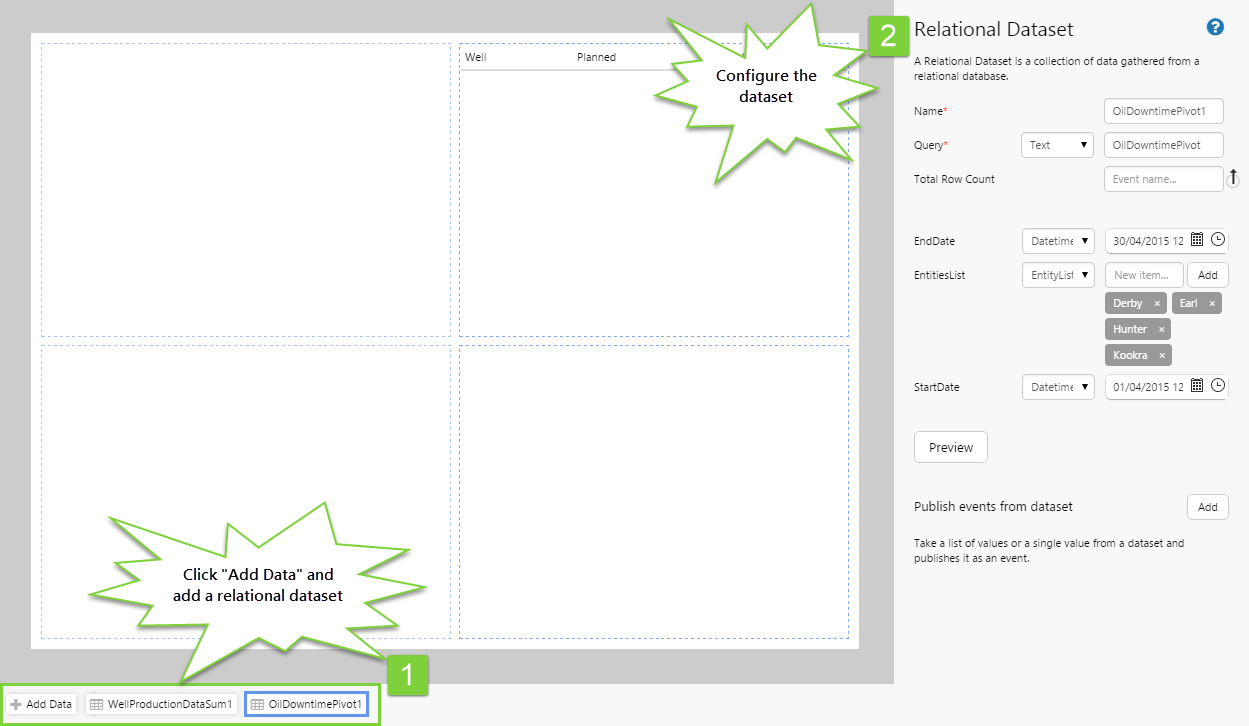
Click “Add Data” and add the OilDowntimePivot dataset. Configure it as follows:
- Name: OilDowntimePivot1
- Query: (Text) OilDowntimePivot
- StartDate: (Datetime) 01/04/2015 12:00:00 AM
- EndDate: (Datetime) 30/04/2015 12:00:00 AM
- EntitiesList: (List) Derby, Earl, Hunter, Kookra
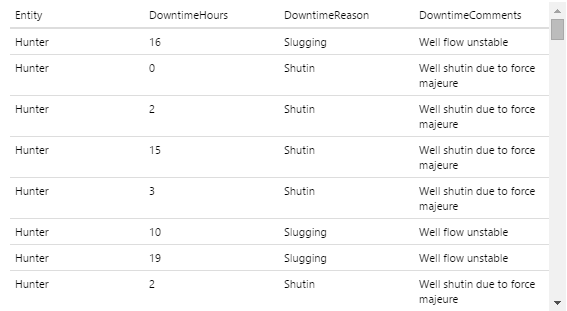
Click the Preview button and observe the columns in the dataset. You may want to leave this preview table open during the remaining steps.
Step 2. Add and configure the Dataset Table component
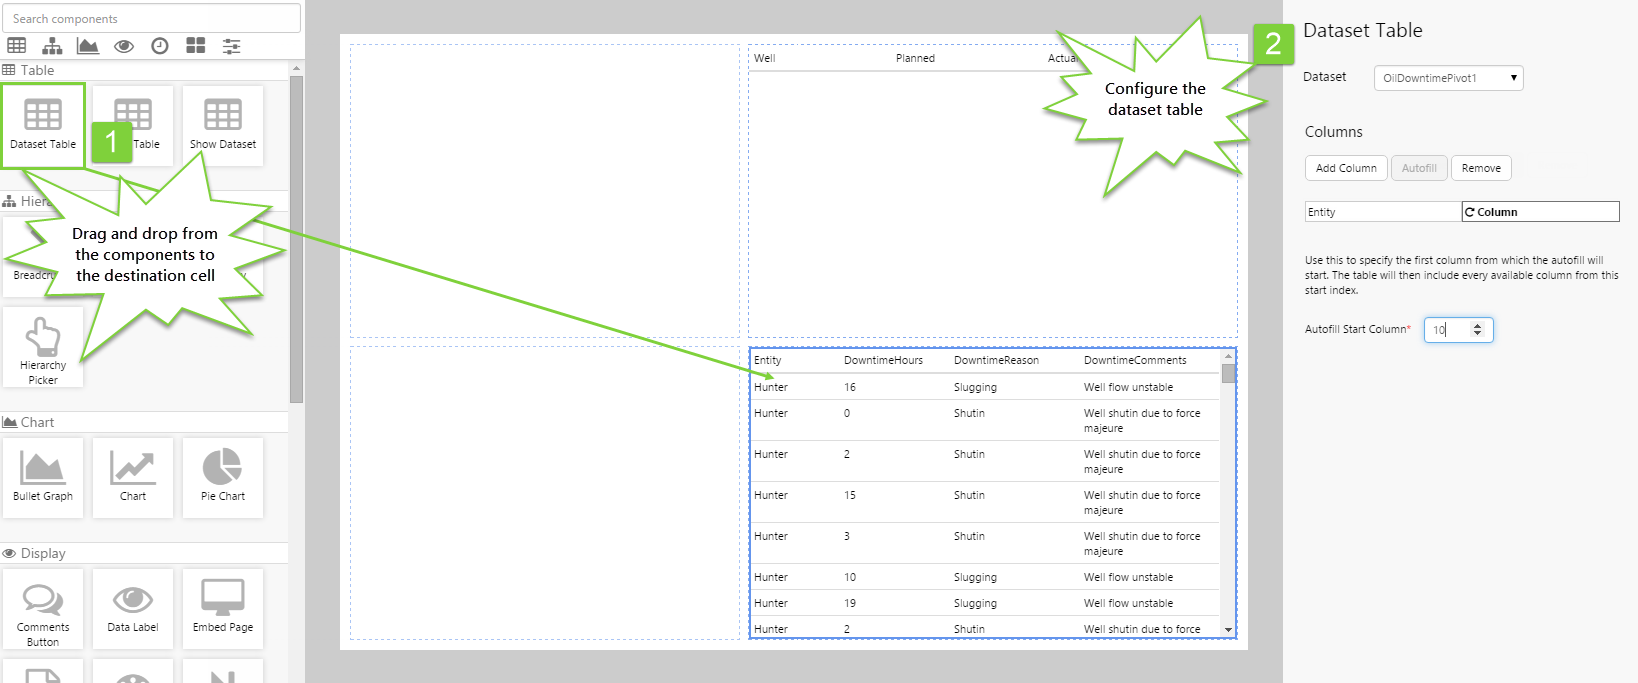
Drag and drop the Dataset Table component onto a grid cell, and configure it as follows:
- Dataset: OilDowntimePivot1
- Columns: 1 row is added by default. Instead of adding more columns as we did earlier, just click “Autofill”.
- Click the first column (on the left). We'll do the same thing we did for the first tutorial.
- In the Column Header box, type Entity.
- In the Column Content section, in the box below “Add Dataset Field”, type Entity and then click “Add”.
- You should now see the text {{row['Entity']}} in the Column Content box.
- Click the second column – this contains the
 autofill icon.
- In Column Start Number box, type 10.
- You should now see a number of columns added to the Dataset Table on the canvas.
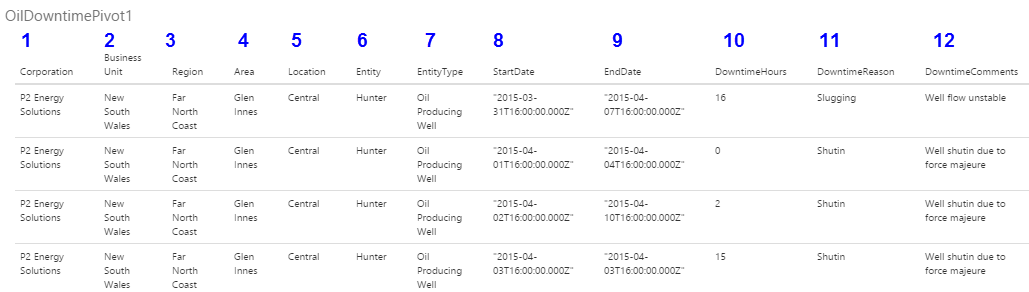
The Column Start Number refers to the number of the column in the table, for example:
Step 3. All done!
Great work! You now have a Dataset Table that displays an undefined number of columns of data. If new columns are added to the dataset, after the DowntimeComments column, those columns will also be displayed in the Dataset Table.
- Click the preview button on the Studio toolbar to see what your page will look like in run-time.
![]() Don’t forget to save your page!
Don’t forget to save your page!