Overview
The Show Dataset component allows the user to view the data in the dataset in a tabular format.
Configuration is simple: you simply supply the name of the dataset, as follows:
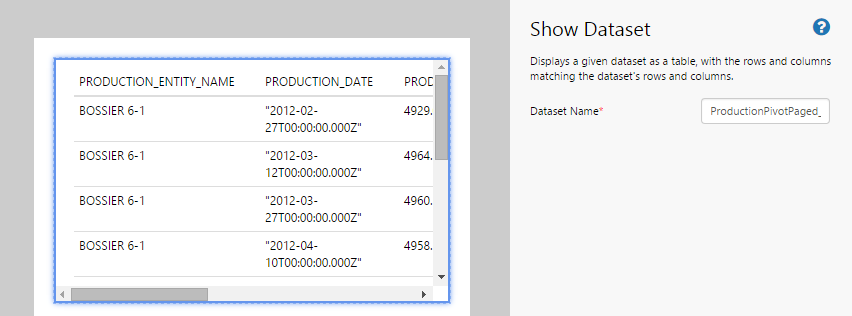
| Dataset Name: | The name of the dataset, as displayed below the canvas. This dataset must be a properly configured tabular or time series dataset. This component will display the same data, in the same format, as the Preview button on the dataset itself. |
Tutorial
Show Dataset is a useful component that enables users to view the data contained within a dataset.
In this tutorial, we’ll look at adding a Show Dataset component that will display the data in a dataset created for a Pivot Table.
Let’s go through this process, step-by-step.
Step by Step: Displaying a Dataset Table on a Page
Before you start, open a new tab in Explorer and click the “Create a New Page in Studio Mode” thumbnail. Choose the grid layout – you can adjust the rows and columns if you like but it’s not important for this exercise.
You will need to adjust the configuration to suit your data at your site.
Step 1. Add the source data

As Show Dataset is designed to display data, the first thing we want to do is add the data we want to display.
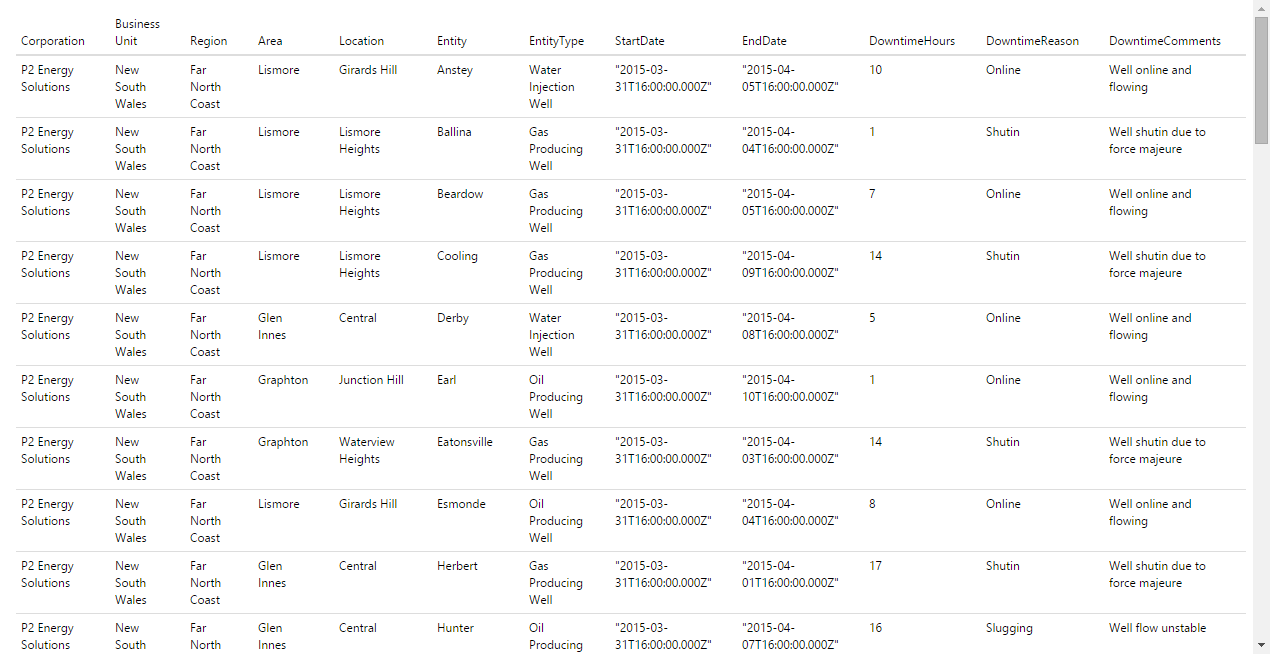
- Add the MiningDowntimePivot dataset, and configure it as follows:
- StartDate: (Datetime) 01/04/2015 12:00:00 AM
- EndDate: (Datetime) 30/04/2015 12:00:00 AM
Step 2. Add the Show Dataset component to the page
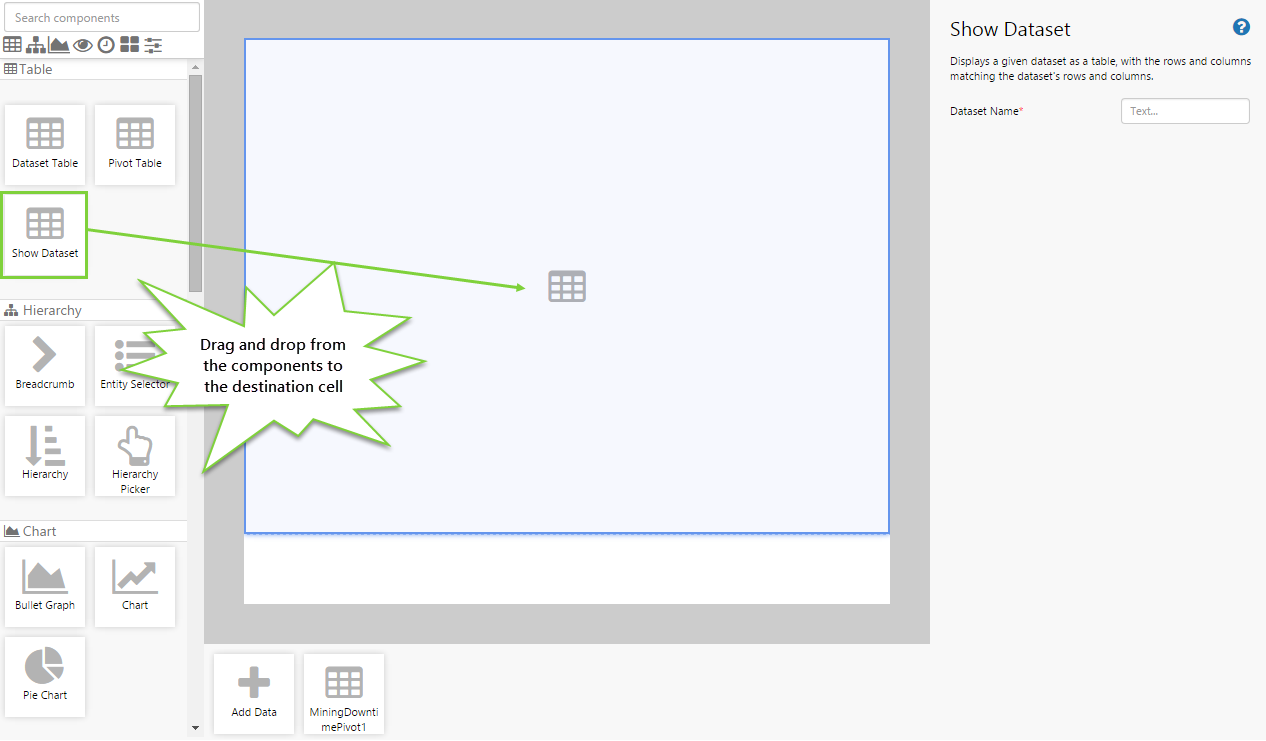
Drag and drop the Show Dataset component onto a grid cell.
Step 3. Configure the Show Dataset component
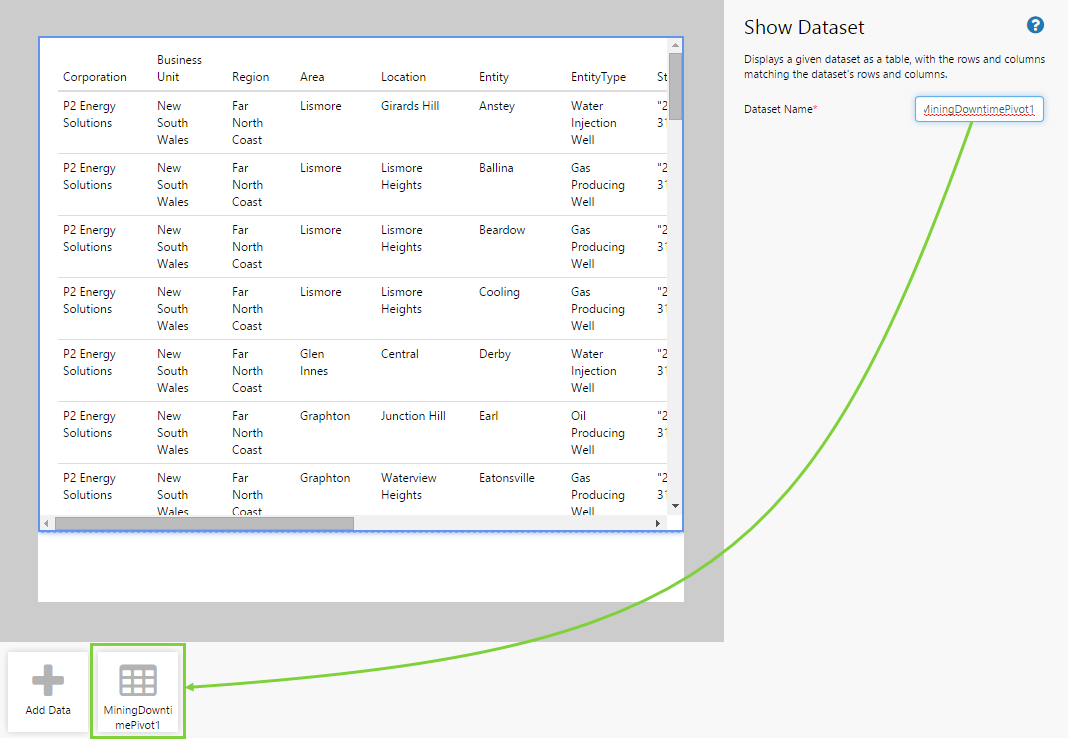
Configure the Show Dataset component as follows:
- Dataset Name: MiningDowntimePivot1
The name of the dataset must be the same as the name of the dataset shown below the canvas.
As you can see, the data will immediately appear in the table. If there is more data than will fit on the page, scrollbars will also appear.
Step 4. All done!

Great work! You now have a fully functioning Show Dataset that displays the data in a specified dataset.
- Click the preview
 button on the Studio toolbar to see what your page will look like in run-time.
![]() Don’t forget to save your page!
Don’t forget to save your page!