ON THIS PAGE:
Overview
The Pivot Table component displays data (selected in design) in sections that are grouped and summed in columns, rows and values that are selected when the page is designed.
If the pivot table is configurable, users can manipulate which columns, rows, and values to display.
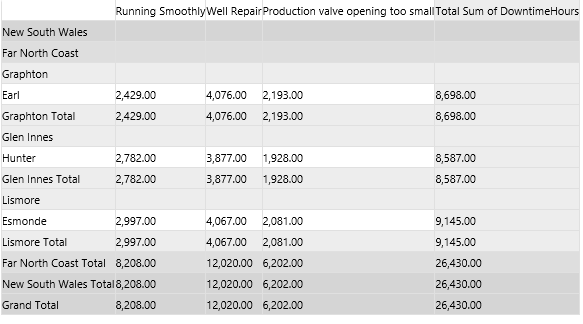
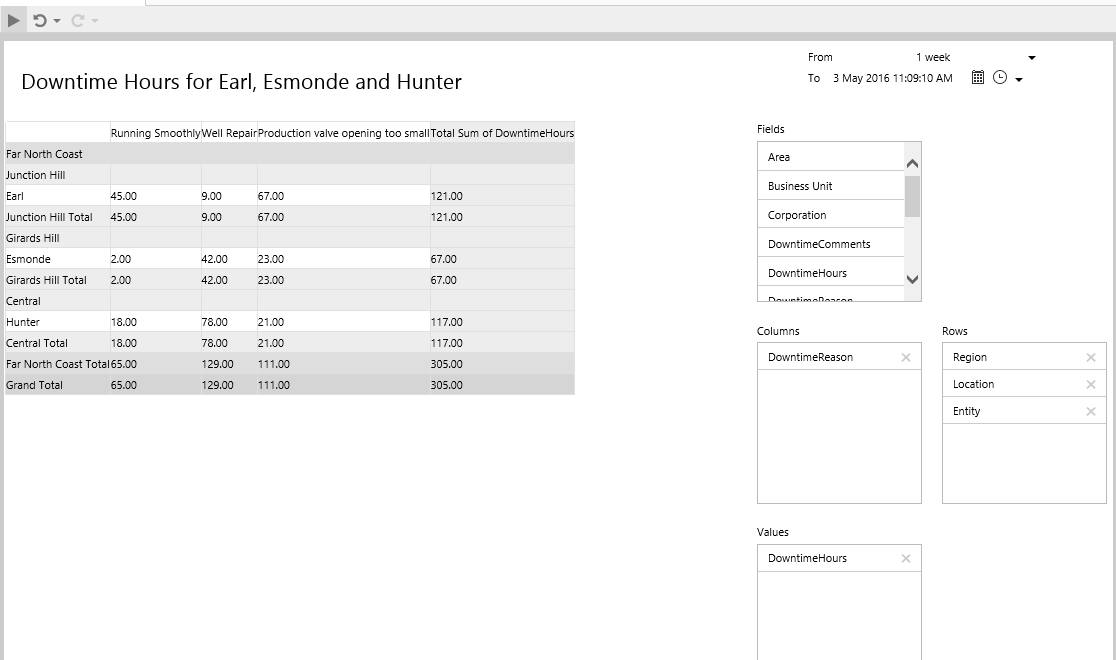
Below is a pivot table without the configuration panel.
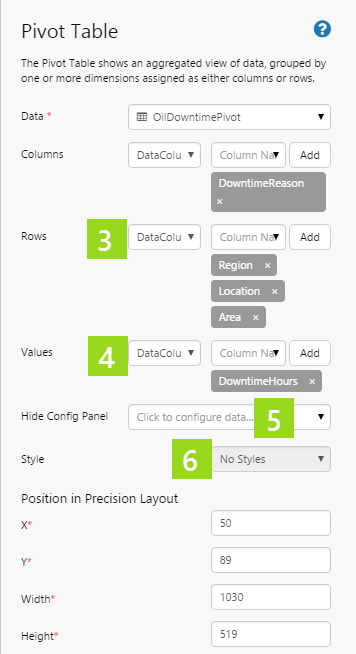
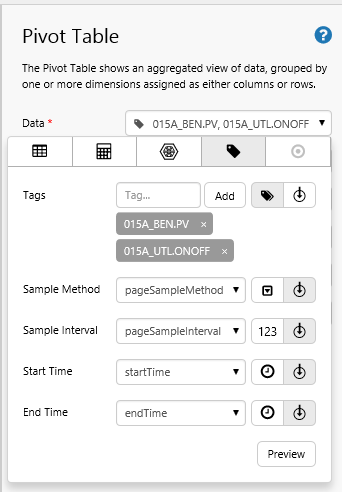
The following diagram shows a Pivot Table being configured:
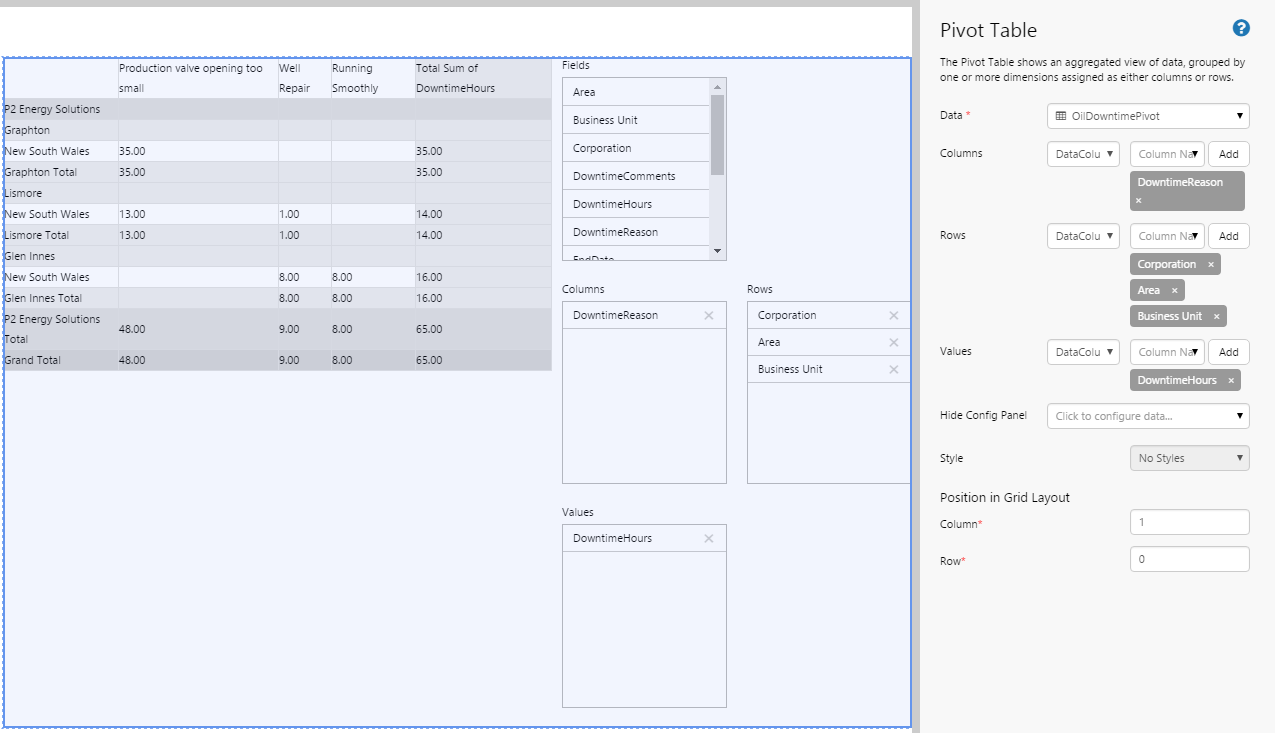
| Data | The source data for the pivot table: this can be from a dataset query, ad hoc calculations, attributes, or tags. |
| Columns | The columns of the dataset that appear as columns in the pivot table. The lowest level is the last in the list. |
| Rows | The data columns of the dataset that appear as rows in the pivot table. The lowest level is the last in the list. |
| Values | The data columns that the pivot table will sum. Choose columns with numerical values. Values are displayed per row and column at the lowest level, and then summed and grouped for the higher levels. |
| Hide Config Panel | Select this check box if you do not want the configuration panel to be visible to the user. The pivot table will appear as configured in design mode, and the user will be unable to manipulate rows, columns, or values. |
| Style | Select a different style, if there are any available in the drop-down list. If you are a Style Administrator, you can add a new Pivot Table style. |
| Position in Grid Layout | This is assigned according to which grid the component occupies (with Columns and Rows beginning at 0). If the pivot table is on a Precision layout, this changes to Position in Precision Layout, with X and Y coordinates and a Width and Height. |
When configuring rows and columns in design mode, list columns and rows in descending order of magnitude, for example: Country, State, City or Area, Field, Well as this is how they will appear in the table.
A pivot table can be configured to display tags, ad-hoc calculations, attribute values for various entities, or columns from a relational dataset.
Tutorial: Pivot Table Allowing User Selections
If you're unfamiliar with the process of building pages, read the article Building an Explorer Page.
In this tutorial, we’ll look at adding a Pivot Table that will change what is displayed as the user selects different dates and times.
Step 1. Prepare the Tutorial Page
Step 2. Add Default Values for Entities
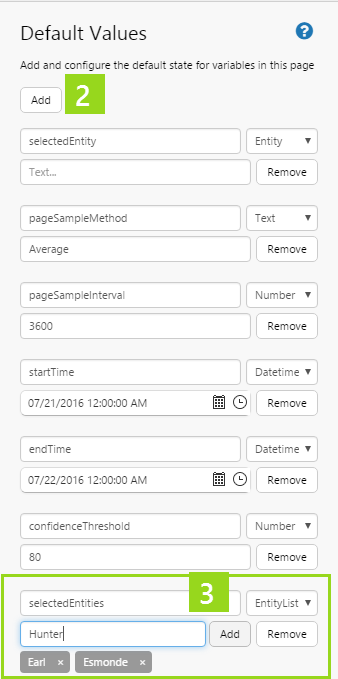
In this step we're going to add a Default Value called selectedEntities, to be used by one of the Pivot Table's dataset query parameters.
1. Open the Default Values panel (click the Defaults button on the Configuration tab group of the Studio ribbon).
2. Click Add.
3. Type a variable name selectedEntities into the edit box, of type EntityList, and add three values: Earl, Esmonde, Hunter.
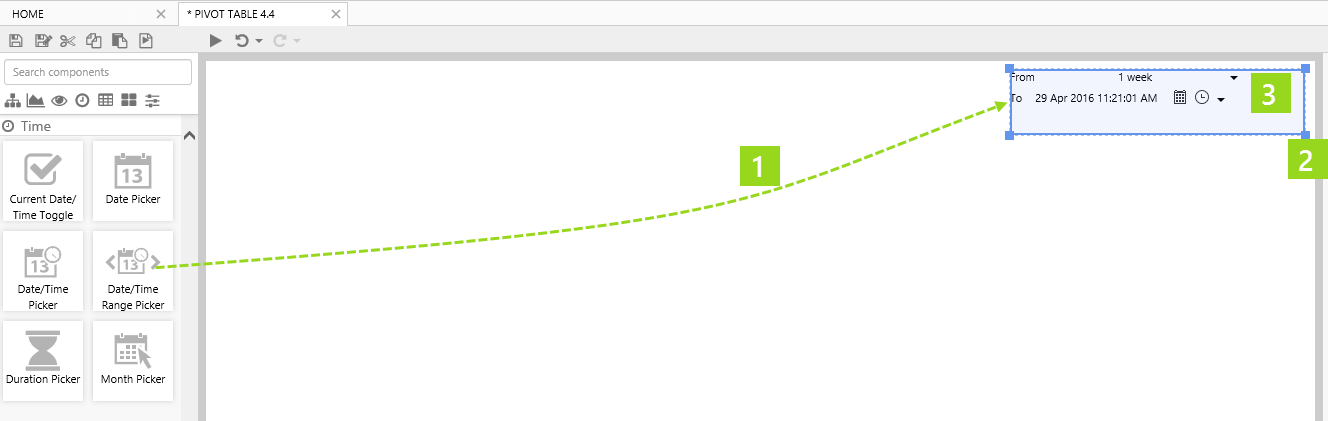
Step 3. Add a Date/Time Range Picker
In this step we'll add a date/time range picker, so that the user can select different dates and times to control the pivot table's dataset query parameters StartTime and EndTime.
1. Drag a Date Time/Range Picker component onto the precision layout on the top right, as shown.
2. Click and drag the edges to widen the component.
3. Click the component to see what the Start Date/Time and End Date/Time components look like.
Leave these to use the Page Defaults for startTime and endTime, respectively.
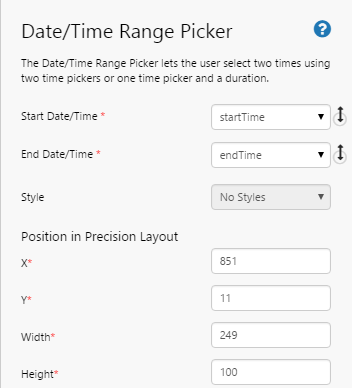
Date/Time Range Picker using startTime and endTime
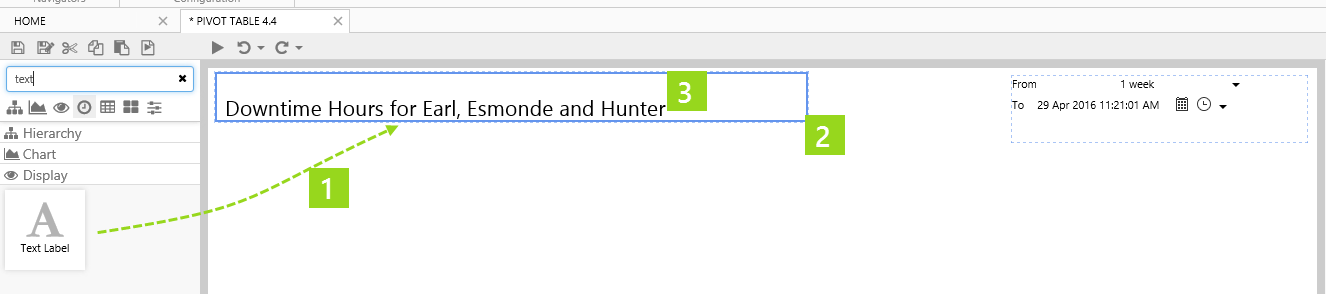
Step 4. Add a Text Label
You can skip this step if you like. The text label here lists the selected entities.
1. Drag a Text Label component onto the precision layout on the top left, as shown.
2. Click and drag the edges to resize to a wider text label.
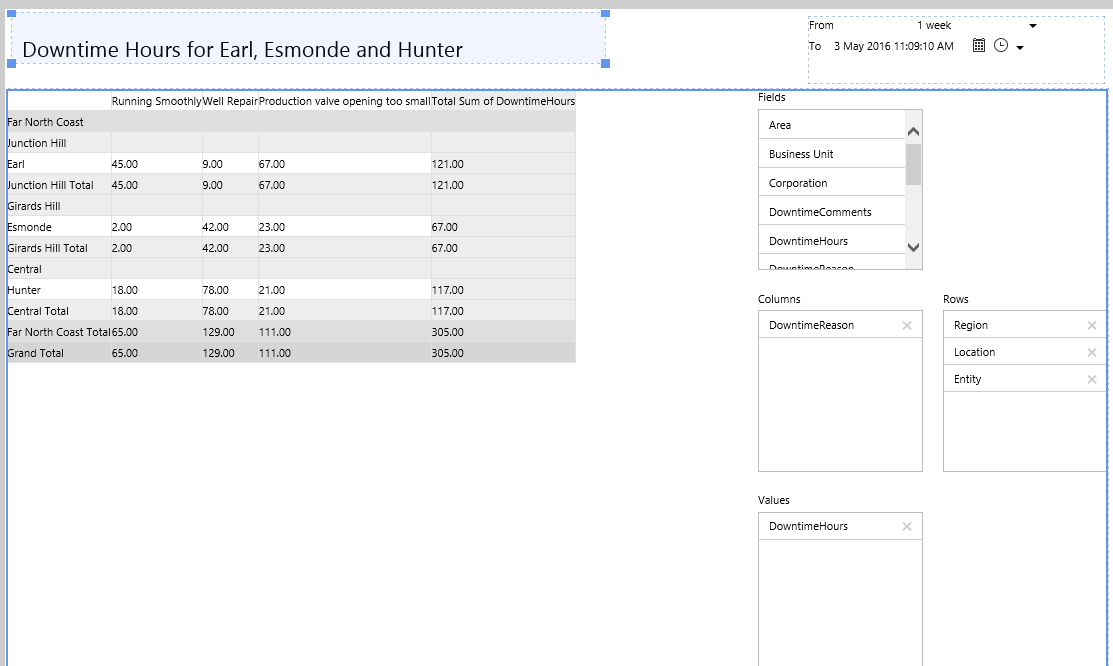
3. Add content to the text label: Downtime Hours for Earl, Esmonde and Hunter, and apply one of the title styles.
Step 5. Add a Pivot Table
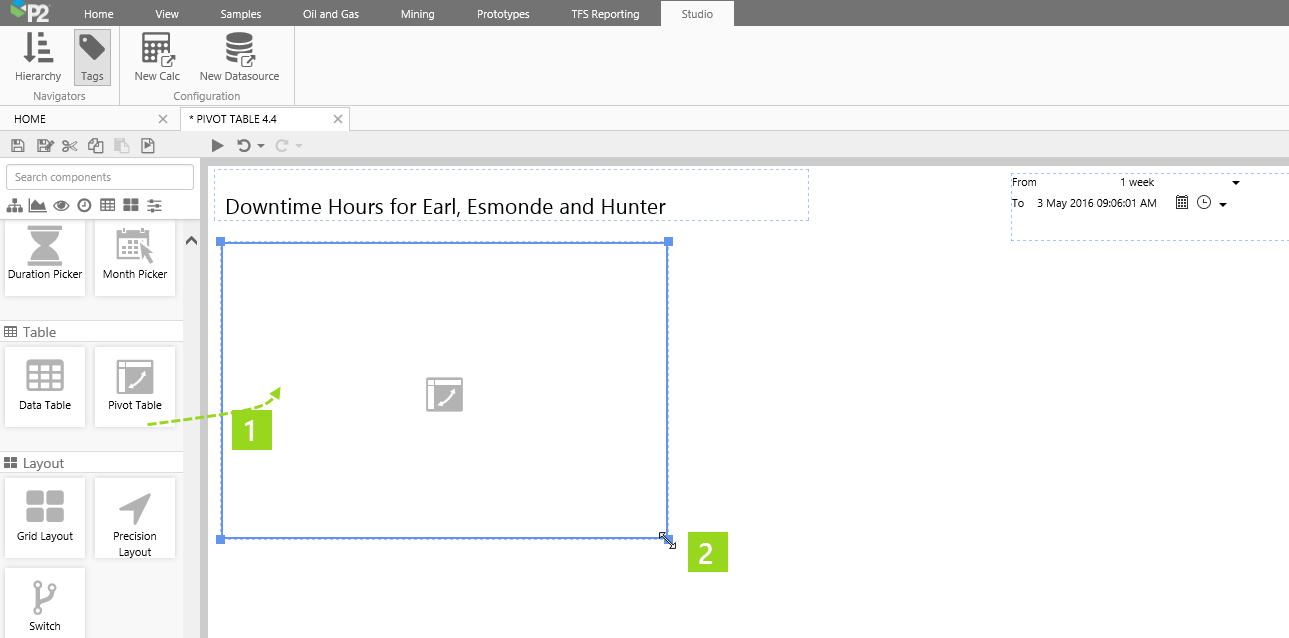
1. Drag a Pivot Table component onto the precision layout, as shown. The Pivot Table is in the Table ![]() group.
group.
2. Click and drag the edges to stretch the component, so that it uses up most of the remaining space on the precision layout.
Step 6. Configure the Pivot Table
In this step, we'll add data to the pivot table. We'll also preconfigure a selection of rows, columns and a value so that the pivot table displays these when the page is opened or refreshed.
Click on the Pivot Table component to configure it.
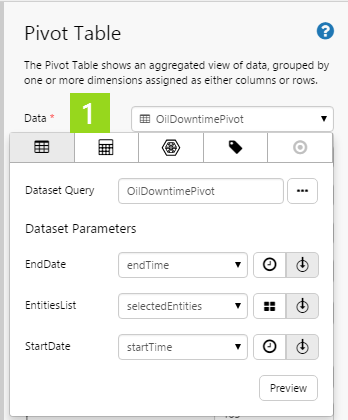
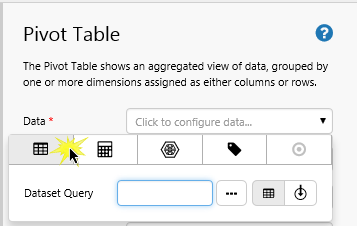
1. Add Data: Add dataset query data to the pivot table, using the Data Selector for Dataset Queries.
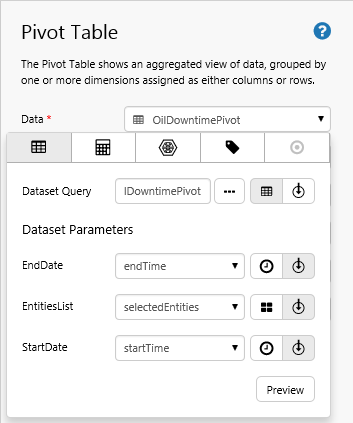
- Select the OilDowntimePivot dataset query from the Oil and Gas Data datasource (or substitute with your own dataset query).
- Allocate values to the Dataset Parameters:
- EndDate: Select the endTime Page Defaults variable
 parameter.
 - EntitiesList: Select the selectedEntities variable parameter.
- StartDate: Select the startTime Page Defaults variable parameter.
- EndDate: Select the endTime Page Defaults variable
- Click Preview to preview the dataset query's resulting dataset.
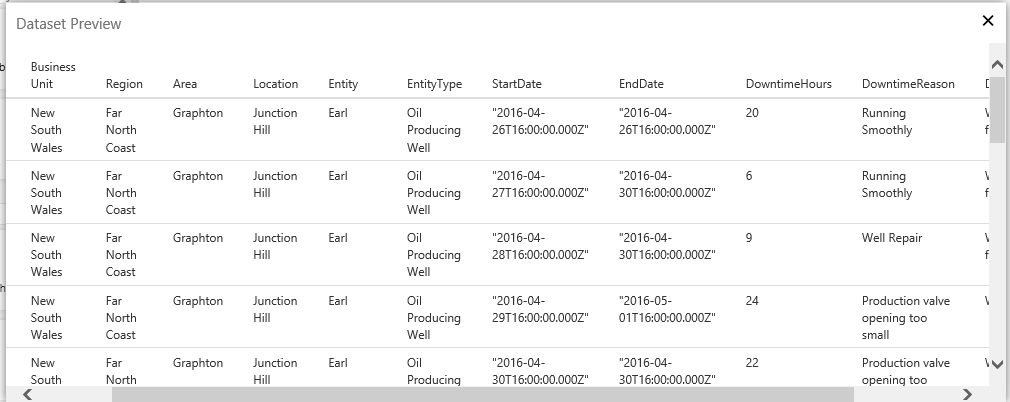
Dataset Preview of the Configured Data
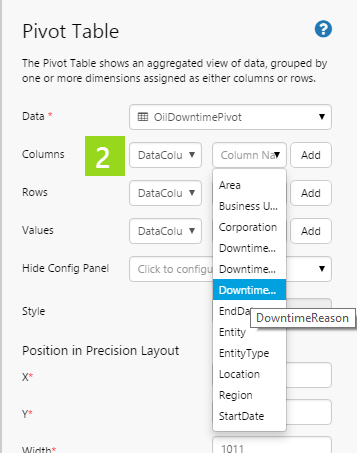
Columns, Rows and Values should match the Fields/Column Names from the Data's dataset (preview the data if you are unsure).
2. Add Columns: Select DowntimeReason from the drop-down list.
3. Add Rows: Select Region, Location, Area from the drop-down list (in that order).
4. Add Values: Select DowntimeHours from the drop-down list.
5. Leave Hide Config Panel as it is, so that users can configure the pivot table in run mode.
6. The style options (if any) may vary. If you are a Style Administrator, you can add a new Pivot Table style.
If you're sure not which rows and columns to add, preview the page (click Preview ![]() on the toolbar) and then choose rows, columns and values from the user interface. When you are happy with your choices, jot these down so you know what to add in design mode.
on the toolbar) and then choose rows, columns and values from the user interface. When you are happy with your choices, jot these down so you know what to add in design mode.
Well done! You've added a pivot table.
Try out the Pivot Table
- Click the Preview
 button on the toolbar to see what your page will look like in run-time.
 - Drag fields to rows, columns and values or from one group to the other.
- Click the X next to an item in the Rows, Column or Values group to remove it from that group.
Hide the Pivot Table's Configuration Panel
Now hide the configuration panel, so that your user cannot change the selected rows, columns or values. This also frees up space for other components.
1. Return to design time (click the ![]() Preview toggle again).
Preview toggle again).
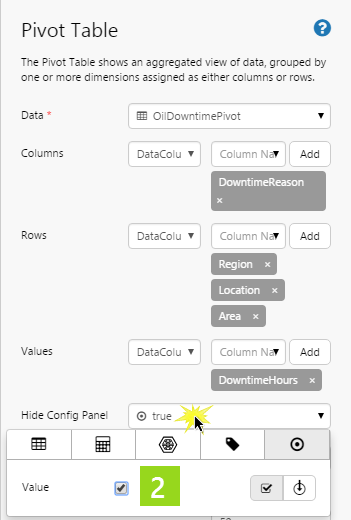
2. Edit the component again, this time setting the Hide Config Panel to true, using Value Data.
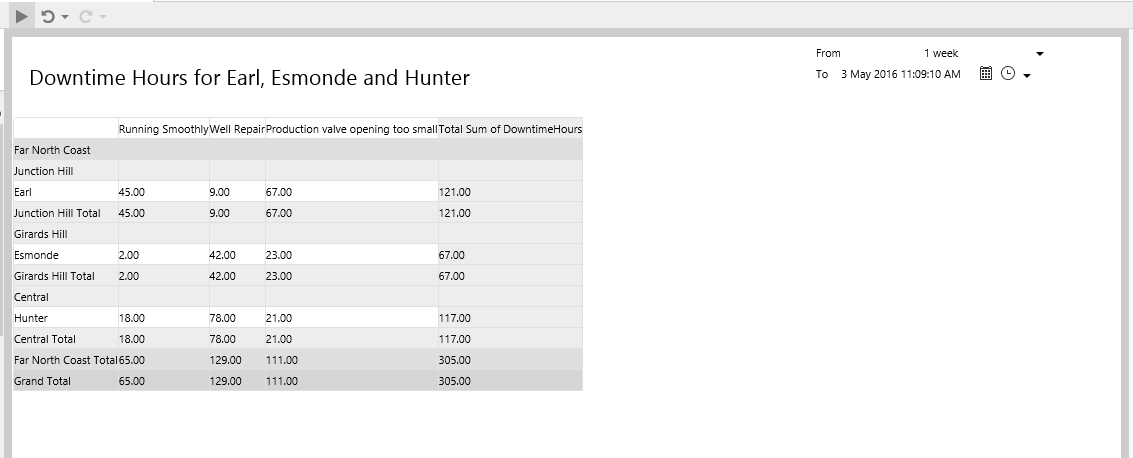
Click the Preview ![]() button on the toolbar to see what your page will look like in run-time
button on the toolbar to see what your page will look like in run-time
Note how the configuration panel is no longer displayed, so that the user is no longer able to manipulate the pivot table layout.
Options for Configuring a Pivot Table's Data
There are four separate categories of data that you can select for your pivot table's Data.
Here is the full reference (including the Dataset Query category, already covered in the tutorial above) to the different data categories you can choose for a pivot table's data.
| Select a Data Category | The Configured Pivot Table's Data |
| Dataset Query Columns: |
 |
| Ad hoc Calculation Columns: |
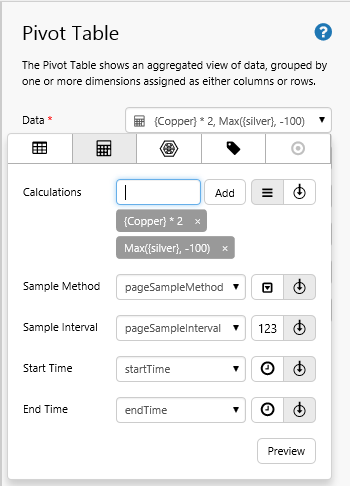 |
| Attribute Columns: |
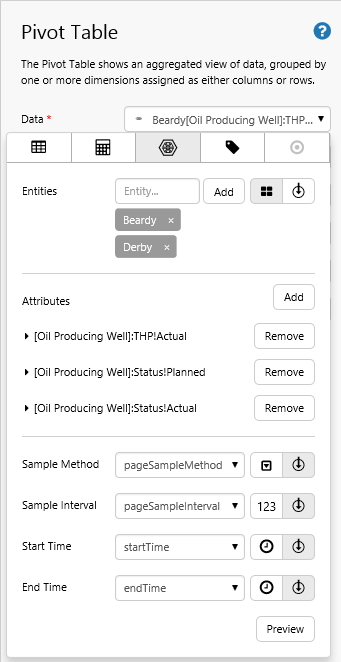 |
| Tag Columns: |
 |