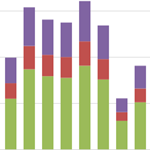
Discrete Versus Continuous Charts (4.5.4)
Explorer Charts can be used to represent Continuous Data or Discrete Data. Find out more about the two types, and how to configure each of them.
Information on something, designed to increase general understanding of that thing.
Explorer Charts can be used to represent Continuous Data or Discrete Data. Find out more about the two types, and how to configure each of them.
A Sparkline is a small Chart component without gridlines, often used to show data trends amidst text (in a table) or alongside images, labels, and lines in a process mimic or schematic. This page explains how to add a sparkline to a page.
P2 Explorer charts work together with user controls to display your data interactively. Read more about the different types of charts, the features they have, and how you can use them.
P2 Explorer allows you to link to a saved trend via a URL. There are 2 ways of doing this: Sharing the link through the P2 Explorer framework, or manually entering the URL. This article examines both methods, and also shows you how to remove the Explorer frame from the trend.
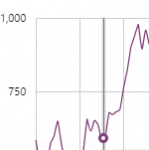
The hairline allows you to see the data values on a chart or trend, at a particular point in time. This article describes the features of a hairline.
Some components allow you to specify Filter Column and Filter Value fields. These are designed to be used together to act as a lookup table of sorts, in order to get the corresponding value from another column in the dataset. This article describes how filter columns and filter values work, in version 4.3.0-4.3.2 of P2 Explorer.
Many of the Explorer components are used for displaying data. For example, the data label, charts, the dataset table, target bars, meters.
Learn how to select and define data within Explorer Studio, using the data selector editor, for versions 4.4 and later of P2 Explorer.
Many of the Explorer components are used for displaying data. The Data Selector is a property field used in many component editors, such as the data label and charts, that makes it easier to add data. This article describes how to use the Data Selector to select and define data for a component.

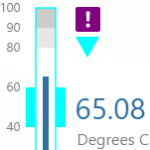
This article provides general tips on how to use Explorer, in particular how to use drag and drop to move data between pages.
IFS OI Explorer process controls consists of a group of four simple shapes - each with the purpose of displaying particular types of measurements against defined limits: Gauge, Level Meter, Pressure Meter and Temperature Meter. This article describes the shapes and how to interpret them. You can also right-click on any of these to view more about the measured values that use tags or attributes.