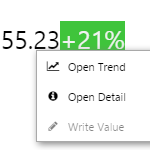
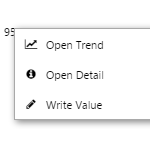
IFS OI Explorer pages have several statistical components for better data visualisation. Learn about the Target Label, Target Bar, and Target Variable Bar components and how to interpret the graphical clues they offer. You can also right-click on any of these to view more about the underlying tags or attribute values that are displayed.
Read more
IFS OI Explorer pages are interactive, allowing you to display labels that can change depending on various selections made on a page. This article describes how labels can change and how to use them to obtain further information from your data.
Read more

All your private pages and trends, as well as your snapshots, in one spot. This page also has a list of submitted pages and trends.
Read more

IFS OI Explorer pages are interactive, allowing you to select different dates and times for which to view your data. This article describes how to use the different date and time pickers to change the focus of your data, and applies to IFS OI Explorer version 4.4 and later.
Read more
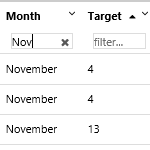
The IFS OI Explorer Data Table displays your data in tabular format (rows and columns).
Possible configuration options include: grouping your data, setting group aggregates, filtering, sorting, hiding, resizing or pinning columns to left or right for more effective scrolling.
Read more
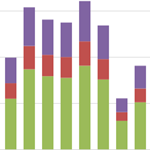
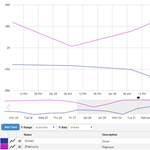
An Explorer chart is made of a series of data points. This article describes the types of series you can add, to display your data.
Read more
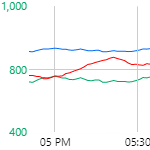
Data is plotted in the trace window, along an X and one or two Y-Axes (left and right). This article describes the features of the trace window, and some of the functions you can do with it.
Read more
Click the markers through this interactive tour to learn about the calculation editor's features, and read the Quick Start to quickly learn how to use it.
Read more
The trace table displays each trace item. You can add up top 20 traces to a trend. You can configure your trace items by updating the table, and you can add or remove trace items in the table.
Read more
The selections you make on the Trend Controls affect the time range of the chart, as well as the data collection method and interval.
Read more