
This article describes the important parameters when configuring a datasource to use the Relational Adaptor to read and write data. It also describes the difference between narrow and wide queries, and provides several examples of each.
Read more
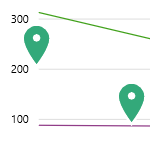
Click through this interactive tour to learn about P2 Explorer Trends.
Read more
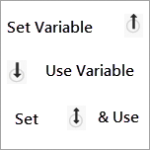
Variables are Explorer's way of providing an interactive user interface.
Find out how to link variables between the various components.
Read more

Snapshots allow you to capture an Explorer page or trend at a point in time, along with all settings and options on the page or trend. This article describes how to take a snapshot and what you can do with them.
Read more
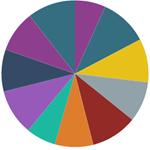
The pie chart is a circular chart divided into sectors. Read about how to use a pie chart.
Read more
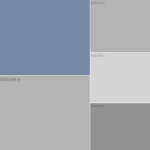
The Treemap shows relative values of numeric data as rectangles of different sizes, with an additional dimension represented by colour coding. Read about how to use the treemap.
Read more

This page answers frequently asked questions about configuring charts in Explorer Studio, for P2 Explorer 4.4.6 and earlier.
Read more
The IP21 Adaptor is a data source adaptor that provides IFS OI Server access to read and write time series tag data to and from the Aspen InfoPlus.21® (IP21) data sources. This article explains how to configure custom mappings of record field names.
Read more

If you're having difficulty deciding what authentication to use when configuring the PI Adaptor, this article's for you.
Read more
Learn how to add data to an embedded trend on an Explorer page, and how to manipulate the embedded trend.
Read more