ON THIS PAGE:
Overview
The data label is one of the most useful of Explorer’s components, as it is used to show time-aware tag and attribute values on Explorer pages.
The data label displays a single data value, and is often used on schematics to display the value of a single entity attribute. There is also a link to trend data and a point details page for the tag or attribute, respectively. Tags and attribute values that can be overwritten have a write option.
As well as being able to display a tag or an attribute, a data label can be configured to display: a column value from a tabular dataset, a single value defined in Studio, or an ad hoc calculation using tag and/or attribute values (see the section Options for Configuring a Data Label Component at the end of this article). Data labels configured to use an ad hoc calculation have a link to a trend.
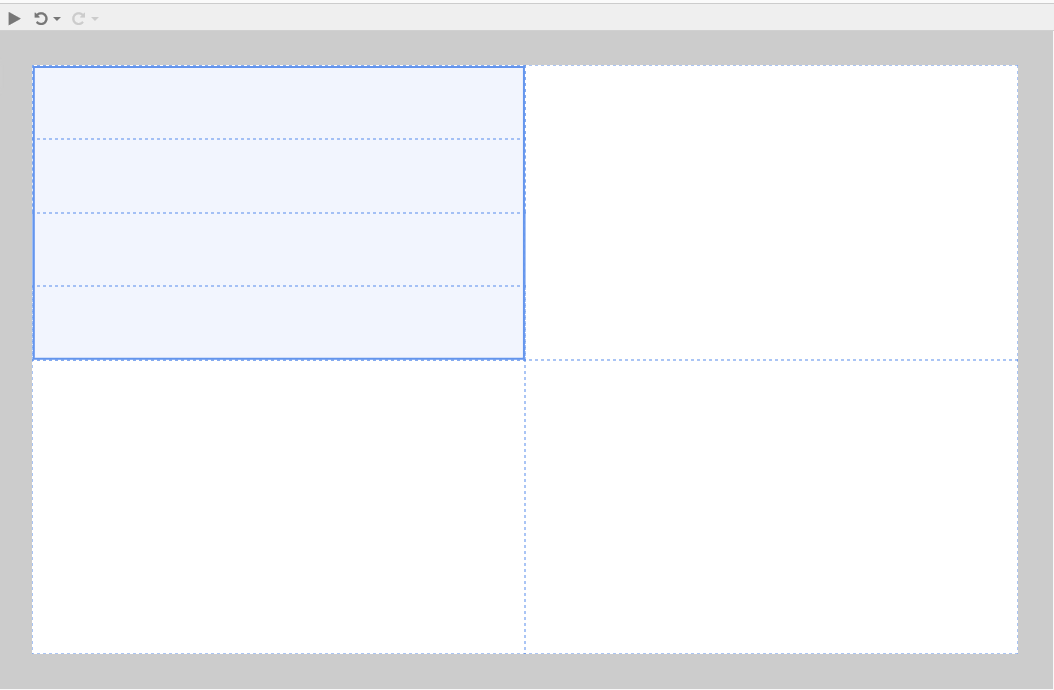
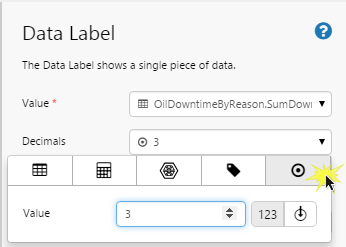
The diagram below shows a configured data label on a precision layout, in Studio mode.
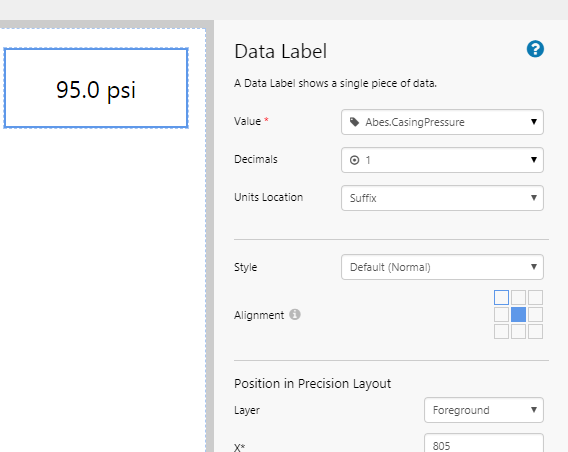
| Value: | The data displayed in the data label. |
| Decimals: | Decimal points for the data. |
| Units Location: | If there is a unit configured for a tag (or an attribute value that uses a tag with a unit), then this can be displayed as a prefix or a suffix to the value, or hidden (select None). |
| Style: | The label style (options may vary). If you are a Style Administrator, you can add a new Data Label style. |
| Alignment | You can override the style's alignment by clicking on one of the other boxes (style's alignment is outlined in blue; overriding alignment is filled in). |
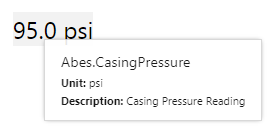
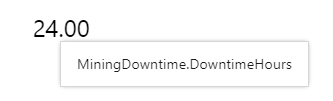
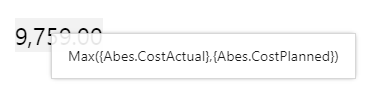
Tooltip
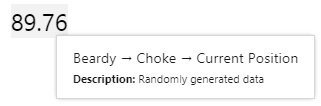
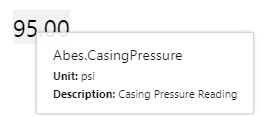
Hover over the Data label to read the tooltip. The tooltip shows the data label’s data definition which could be a tag name, a fully qualified attribute name, an ad hoc calculation, or a dataset query name with value column name. Data labels for tags and attributes show units (where available), as well the description.
Right-click Menu Options
And this is how the same data label looks in display mode when you click on it (with a slightly changed value, as this is data for a different time):
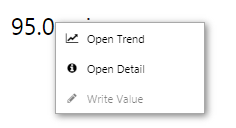
- Open Value Trend

- Open Value Detail

- Write Value

Note: If the data label's value is a tag or calculation that has a digital state set assigned, the corresponding digital state pair's Name is used instead of the Value, if there is a match.
No changes to the Data Label's configuration are required. Read more: Digital State Sets.
Choosing a Value for the Data Label
There are two ways you can assign a value to a data label:
- Drop an attribute or a tag onto the page: Tutorial 1.
- Drop a data label onto the page, and configure it: Tutorial 2.
We’ll explore these two methods in the following tutorials.
Tutorial 1: Dragging Data onto a Page
If you're unfamiliar with the process of building pages, read the article Building an Explorer Page.
This is a quick way to add a data label to a page.
We’re going to search for an attribute and a tag to drop onto two separate grids on the page.
If you don't have access to the training environment, search for attributes or tags within your own environment to follow this exercise.
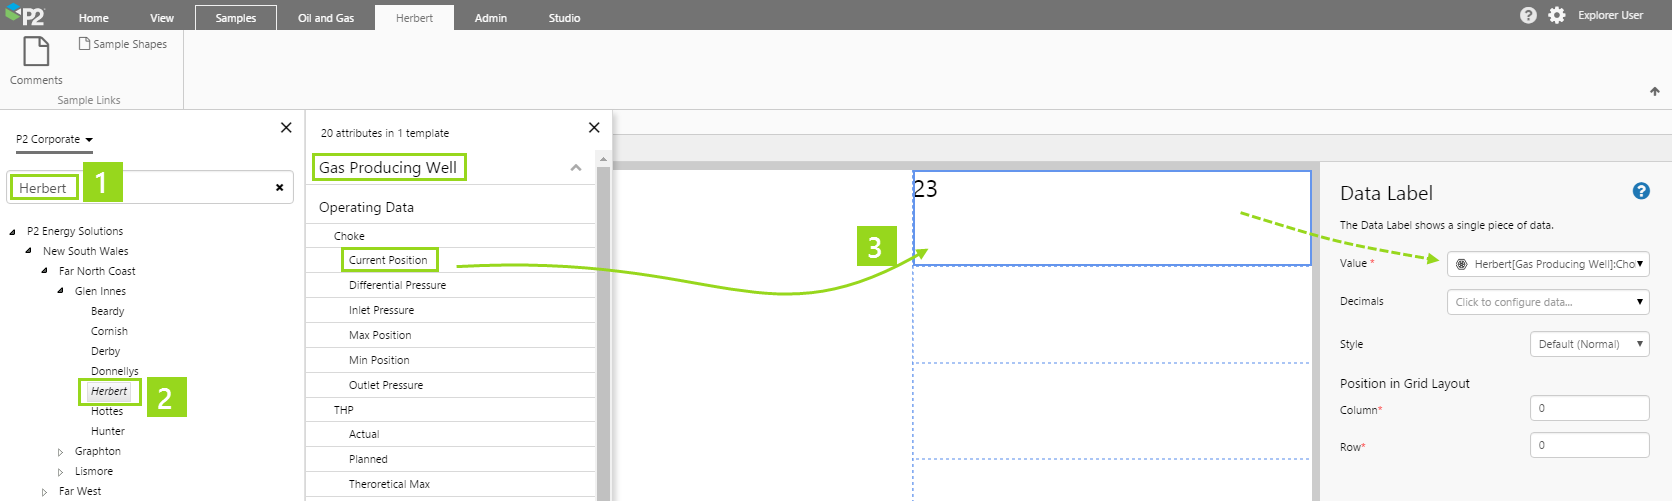
1. Search for Entity: Search for Herbert in the P2 Corporate hierarchy.
2. Click the Entity: This opens the Attributes Panel.
3. Drag an Attribute Onto the Page: Locate the Choke!CurrentPosition attribute, in the Gas Producing Well template, and drag it onto a grid cell.
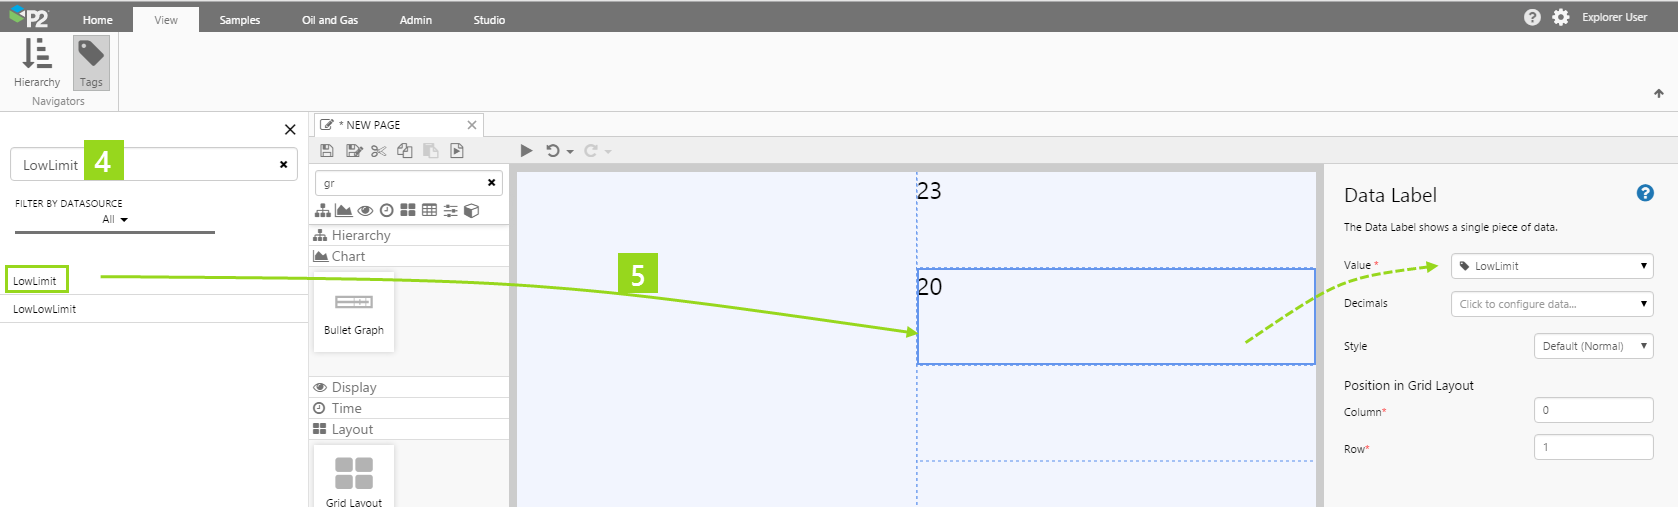
4. Search for a Tag: Search for the LowLimit tag.
5. Drag the Tag Onto the Page: Locate the LowLimit tag from the search results, and drag it onto a grid cell.
Your data label is ready. Tutorial 2 has instructions for configuring Decimals and Style (see steps 3 and 4).
Tutorial 2: Configuring a Data Label Component
In this tutorial, we'll drop a data label component onto a page, and then configure it to show data.
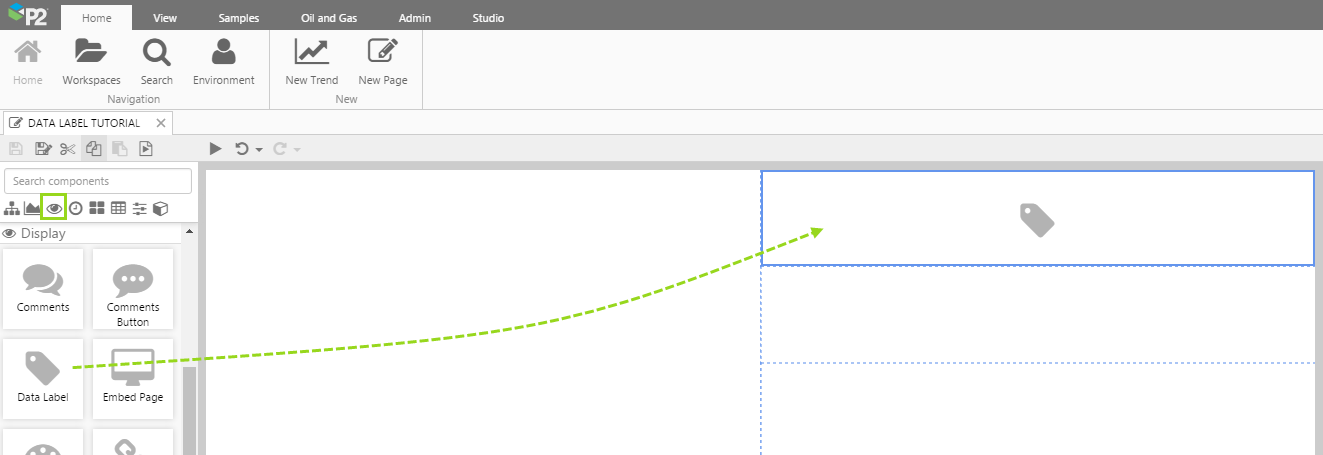
1. Add a Data Label: Drag and drop a Data Label component onto a grid cell. The Data Label is in the Display ![]() group.
group.
In this example, we'll configure the data label to show a column from a dataset.
Follow the instructions in the Data Selector article, in the section: Using Dataset Data.
- Dataset Query: OilDowntimeByReason
- Filter Column: DowntimeReason
- Filter Value: No Truck
- Value Column: SumDowntimeHours
- EndDate: 04/30/2016
- Entities List: Brumby, Big Red, Archer
- StartDate: 04/01/2016

3. Configure the Decimals: We're going to configure to three decimal places.
Note: If decimal places are un-configured, the default is 2. If the data comes from a tag, and this has a configured decimal value, then this overrides the default.
Follow the instructions in the Data Selector article, in the section: Using Dataset Data.
4. Update the Style: The data label has a default style. To choose another style, click the Style drop-down list, and click on the style you want.
That's all - your data label is configured.

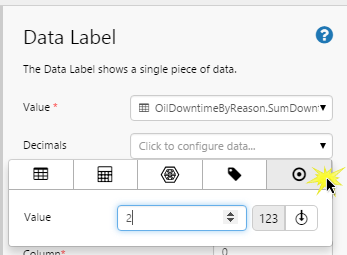
Options for Configuring a Data Label Component
There are five separate categories of data that you can select for your data label Value. Likewise, you can configure Decimals to use any of the five categories.
Here is the full reference (including the categories already covered in this tutorial) to the different data categories you can choose, for either of these properties of the data label component.

![]()
| Design Mode | Display Mode | ||
| Select a Data Category | See How | The Configured Data Label's Value | In Display Mode, hover over the Data Label |
| Dataset Column: Configure your data label's Value to use a column from a dataset.
|
Using Dataset Data | 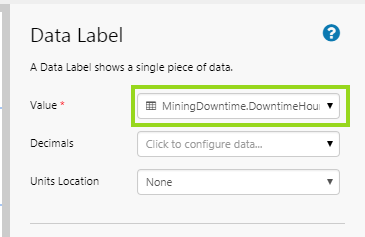 |
 |
| Ad hoc Calculation: Configure your data label's Value to use an ad hoc calculation.
|
Using Ad hoc Calculation Data |  |
 |
| Attribute: Configure your data label's Value to use an attribute.
|
Using Attribute Data | 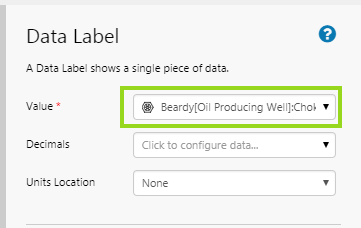 |
 |
| Tag: Configure your data label's Value to use a tag.
|
Using Tag Data | 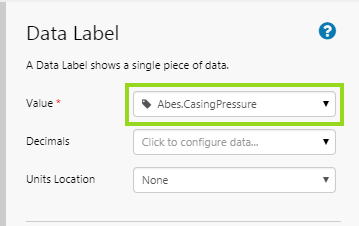 |
 |
| Here the tag has a digital state set assigned, and the corresponding Name is shown, instead of the Value | 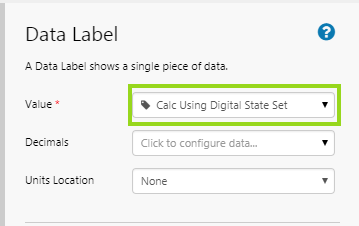 |
 |
|
| Value: Configure your data label's Value to use a value.
|
Using Value Data | 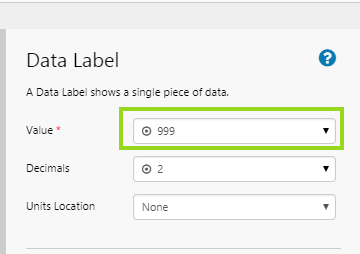 |
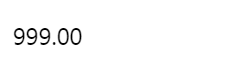 |
| Here the value is text. | 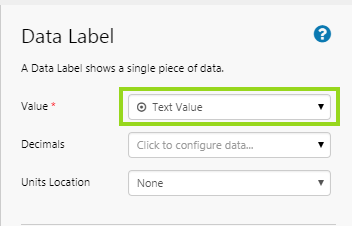 |
 |
Supplementary: Dataset Query Syntax
This is the syntax of the query on P2 Server, that is used in Tutorial 2: OilDowntimeByReason.
select sum(downtimehours) as SumDowntimeHours,
            downtimereason
       from sampledata
      where startdate between PARAM(StartDate, datetime) and PARAM(EndDate, datetime)
        and entity in (PARAMS(EntitiesList, entity))
      group by downtimereason
Release History
- Data Label 4.5.3 (this release)
- If the data label's value is a tag or calculation that has a digital state set assigned, the matching digital state pair's Name is used instead of the Value if there is a match. No changes to the Data Label's configuration are required.
- The data label's tooltip has changed; it now shows the data label’s data definition which could be a tag name, a fully qualified attribute name, an ad hoc calculation, or a dataset query name with value column name. Data labels for tags and attributes show units (where available), as well the description.
- Data Label 4.5.2:
- The alignment that is based on the allocated style can be overridden with the new Alignment property.
- Data Label 4.4.5
- The Ad Hoc Calculation editor has an additional option, for configuring an entity variable, called Entity Context. This article contains a tutorial showing how to use Entity Context for configuring templated calculations.
- Tags can have units configured and stored in P2 Server. These can be displayed in the Data Label, using the new Units Location property.
- Tag decimals are configured and stored in P2 Server, which means they don't need to be configured for the component.