ON THIS PAGE:
Overview
The Pivot Table allows users to automatically sum the data stored in a dataset, and display the results in a table with specified rows and columns. The Pivot Table component can be displayed on a page as a preconfigured table, or it can allow the user to change the pivot points to analyse different aspects of the source data.
The following diagram shows a Pivot Table being configured:
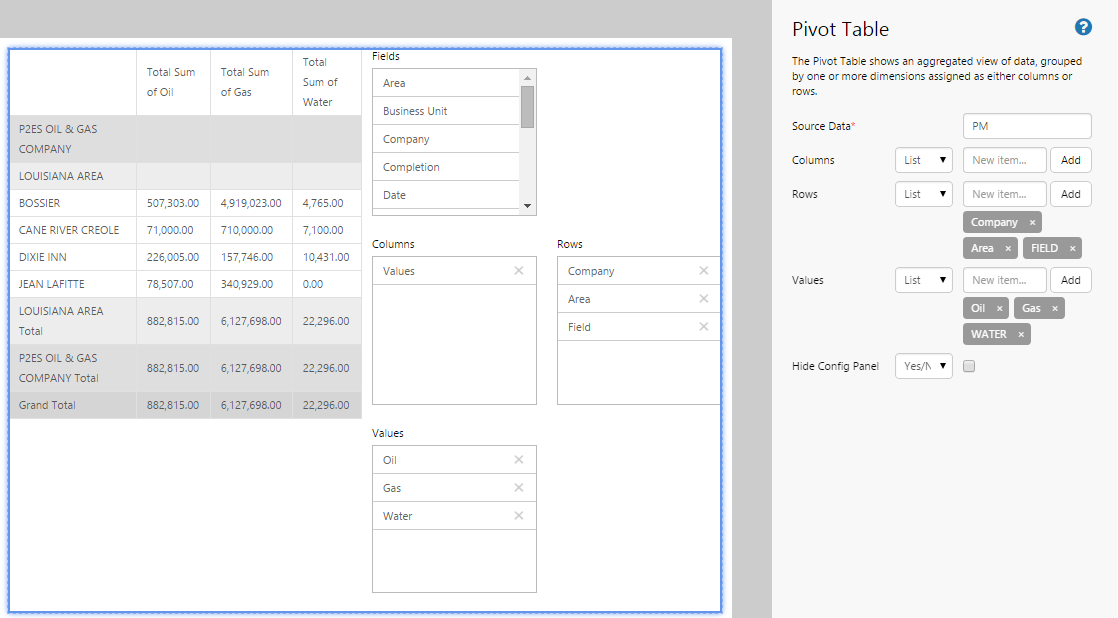
| Source Data: | The dataset from which the pivot table sources its data. |
| Columns: | The columns of the dataset that appear as columns in the pivot table. |
| Rows: | The columns of the dataset that appear as rows in the pivot table. |
| Values | The columns of the dataset that the pivot table will analyse. Not all columns will be suitable to add to this area; you would typically only add those columns with numerical values, such as downtime hours. |
| Hide Config Panel | Select this check box if you do not want the configuration panel to be visible to the user. This will result in just the table being displayed on the page, and the user will be unable to change the pivot points. |
Tutorial
The Pivot Table is a useful component that enables users to view and analyse tabular data in different ways.
In this tutorial, we’ll look at adding a Pivot Table that will change what is displayed as the user selects different times.
Let’s go through this process, step-by-step.
Step by Step: Creating a Pivot Table Driven by a Range Picker and Entity Selector
Before you start, open a new tab in Explorer and click the “Create a New Page in Studio Mode” thumbnail. Choose the grid layout – you can adjust the rows and columns if you like but it’s not important for this exercise.
You will need to adjust the configuration to suit your data at your site.
Step 1. Add the source data
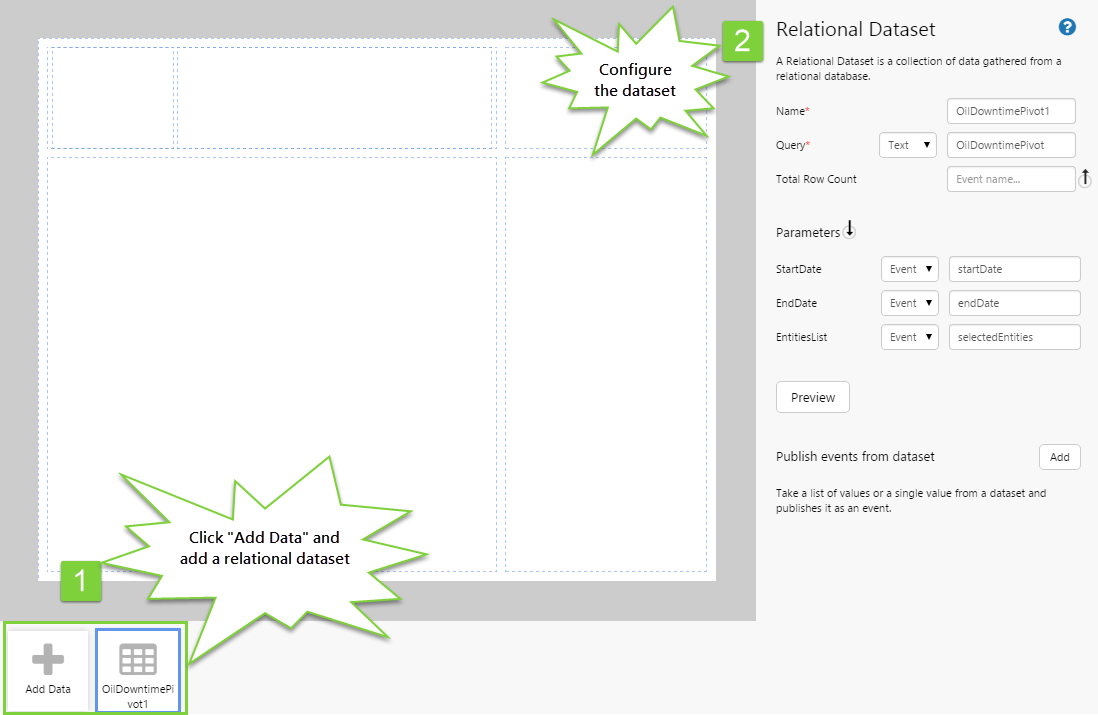
As Pivot Tables are designed to display data, the first thing we want to do is add the data we want to display.
- Add the OilDowntimePivot dataset, and configure it as follows:
- StartDate: (Event) startDate
- EndDate: (Event) endDate
- EntitiesList: (Event) selectedEntities
Later in this tutorial, we will add a date/time range picker to supply the start and end dates, and an entity selector to supply the list of selected entities.
Step 2. Add the Pivot Table to the page

Drag and drop the Pivot Table component onto a grid cell.
Step 3. Configure the Pivot Table
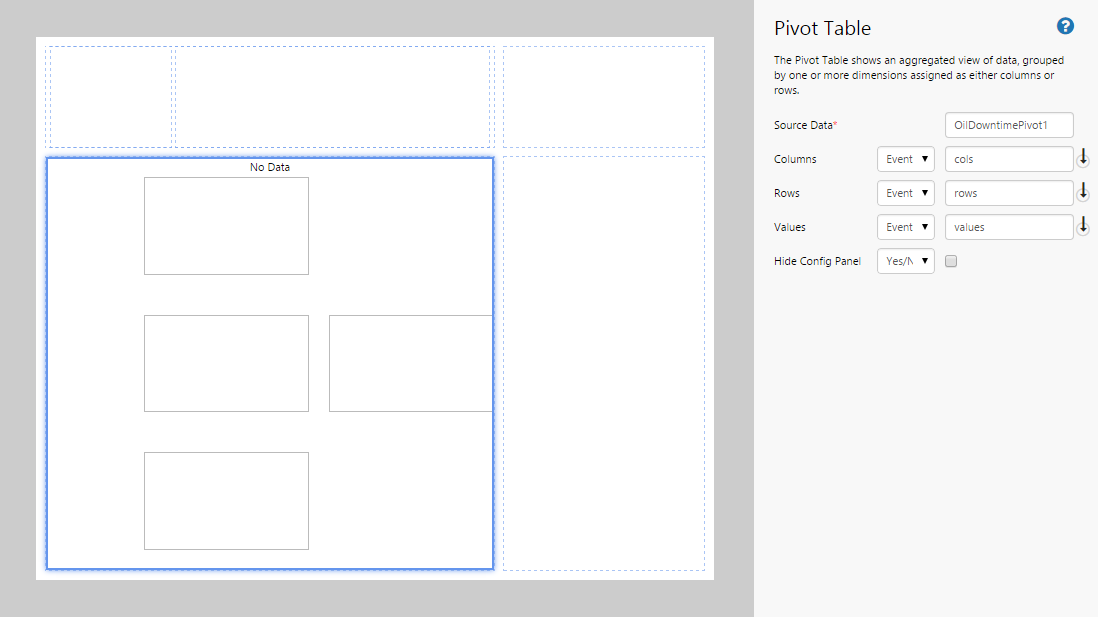
In this example, we want the user to be able to specify their own rows, columns, and values for the pivot table, so we will configure these as events. Configure the Pivot Table as follows:
- Source Data: OilDowntimePivot1
- Columns: (Event) cols
- Rows: (Event) rows
- Values: (Event) values
- Hide Config Panel: (unselected)
Before we start creating events, there are 2 more components we want to add: an entity selector (so the user can specify the entities they are interested in) and a time range picker (so the user can specify the time range they are interested in). Let's do this now.
Step 4. Add and configure the Entity Selector
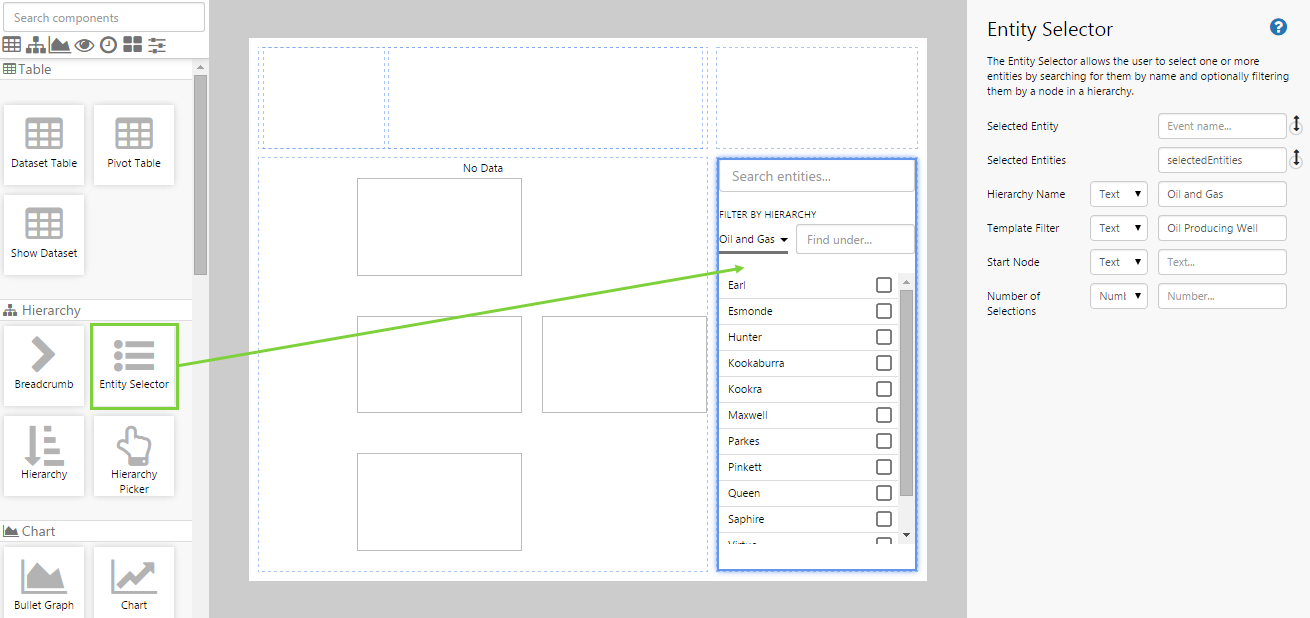
Add the Entity Selector component and configure it as follows:
- Selected Entities: selectedEntities
- Hierarchy Name: (Text) Oil and Gas
- Template Filter: (Text) Oil Producing Well
Step 5. Add and configure the Date/Time Range Picker
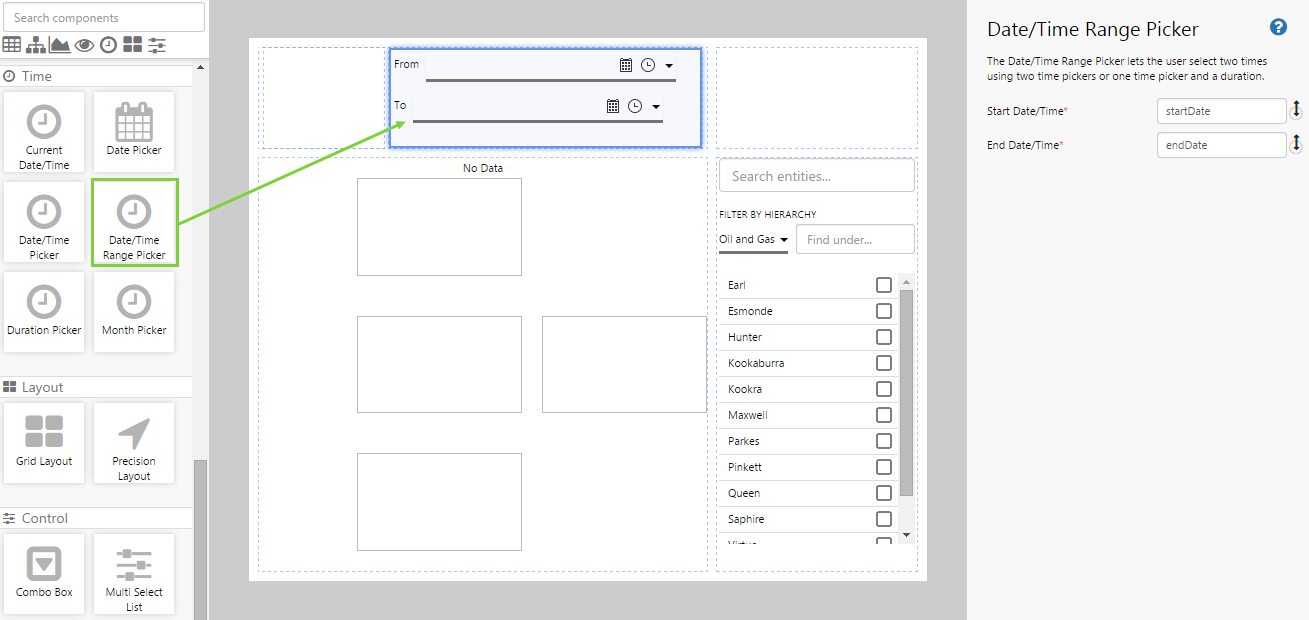
Add the Date/Time Range Picker component and configure it as follows:
- Start Date/Time: startDate
- End Date/Time: endDate
Step 6. Create the event defaults
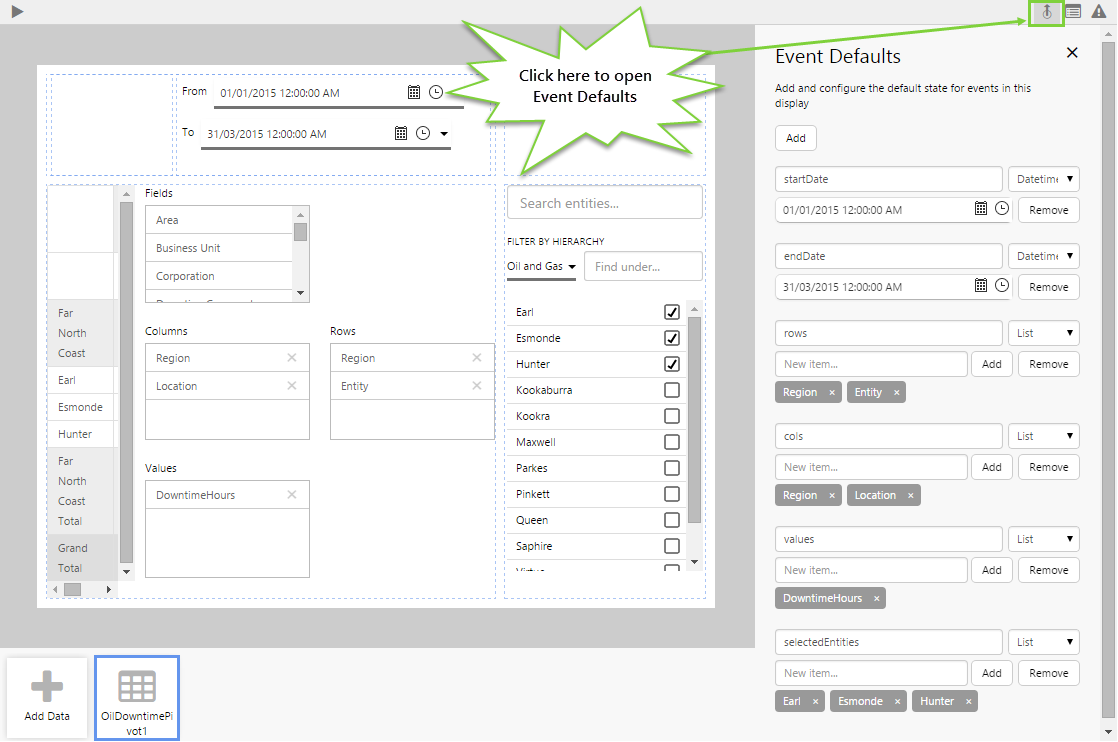
Now we'll pull all the pieces together by creating some events.
- Click the Event Defaults button on the far right side of the Studio toolbar.
- Add an event called “startDate” with a Datetime set to 1 January 2015 12:00:00 AM.
- Add an event called “endDate” with a Datetime set to 31 March 2015 12:00:00 AM.
- Add an event called “rows” with a List of: Region, Entity
- Add an event called “cols” with a List of: Region, Location
- Add an event called “values” with a List of: DowntimeHours
- Add an event called "selectedEntities" with a List of: Earl, Esmonde, Hunter
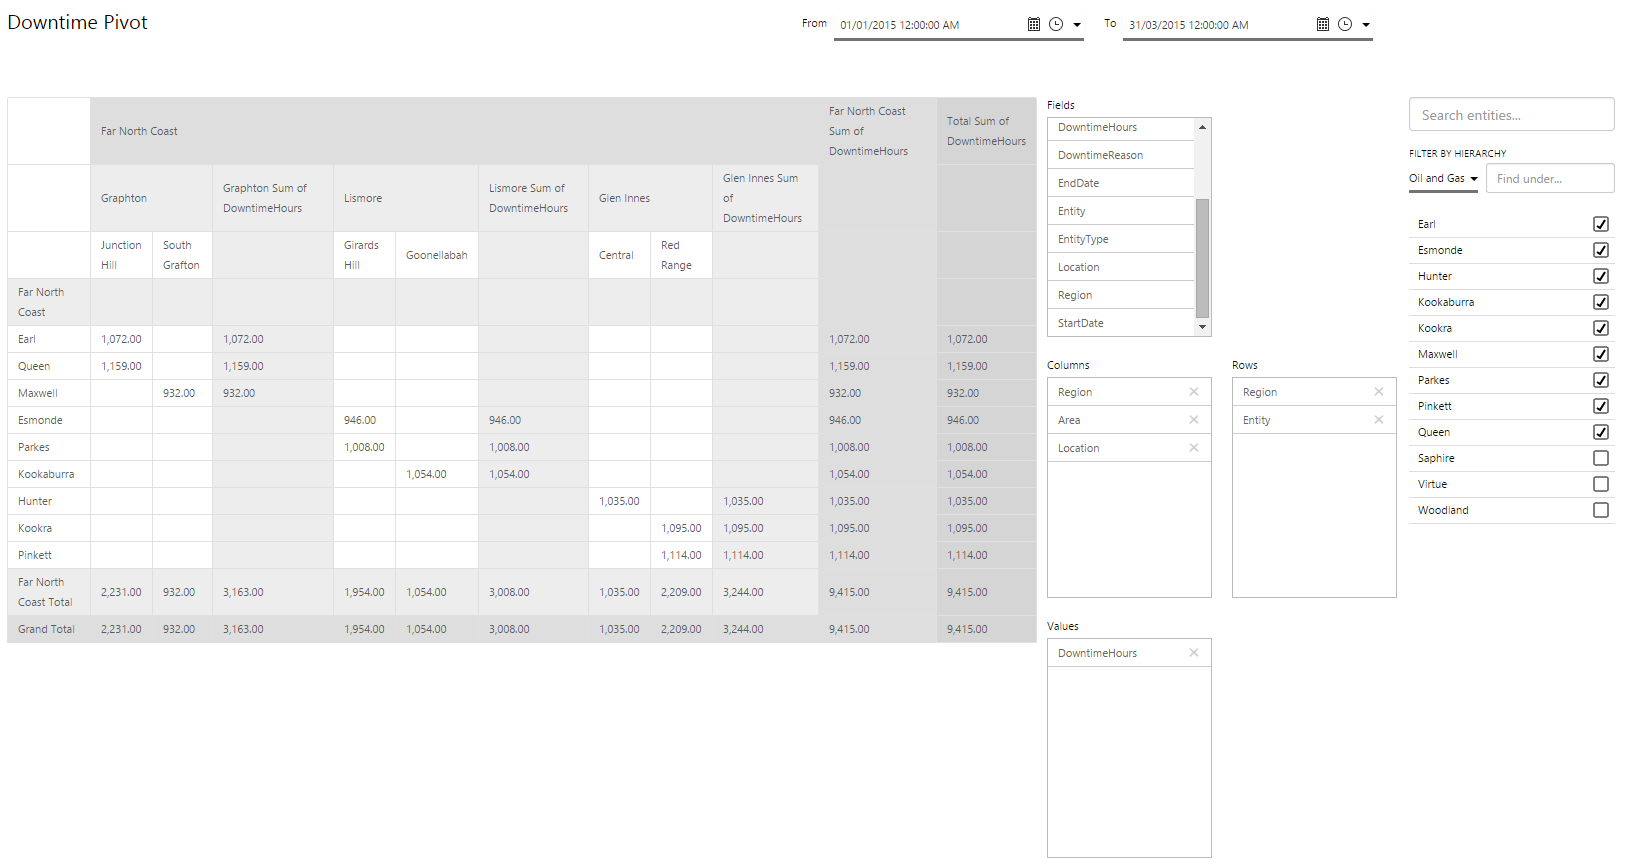
Step 7. All done!
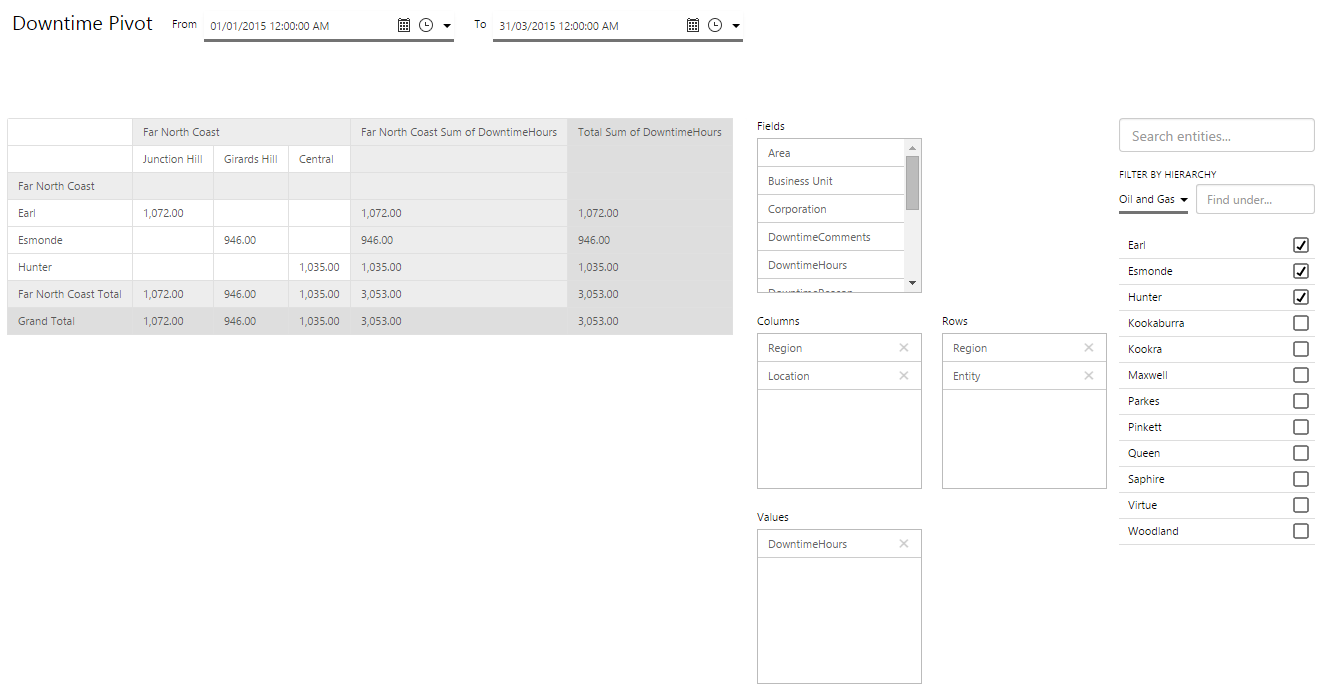
Great work! You now have a fully functioning Pivot Table that displays data for different entities and different time ranges.
- For an added bonus, add a Text Label to add a title of "Downtime Pivot" to the page.
- Click the Finish and Open
 button on the Studio toolbar to save your page and see what it will look like in run-time.
 - Change the dates and select different entities to see how the Pivot Table changes to display the related data.
![]() Don’t forget to save your page!
Don’t forget to save your page!