ON THIS PAGE:
Overview
Precision Layout is typically used for pages that contain schematic diagrams, or for other designs where using a Grid Layout is too restrictive or complicated.
This layout lets you put components anywhere on a page and make them any size. However, each component’s size and position is set during design mode, and therefore will not scale for different screen resolutions during display mode.
When to Use Precision Layout
You should use Precision Layout when:
- You need to build schematic-style pages
- You need to build a mimic
- You want to have an image map where users can click on different parts to navigate to another page
- You don't need a page that resizes responsively
- Components need to be precisely positioned in relation to one another.
How to Use Precision Layout
Precision Layout can mixed and matched with the Grid Layout for greater page layout manipulation. Here are some examples.
Manipulate page resolution: Inserting a Precision Layout into a Grid Layout cell allows you to manipulate the resolution of the page so that it is fixed in one part and flexible in another.
Add hotspots in a Grid Layout: Inserting a Precision Layout into a Grid Layout cell allows you to then overlay an image and a hotspot in that grid cell.
Add a legend to a mimic: Adding a Grid Layout over a Precision Layout allows you to neatly align components such as Text Labels and Images, to form a legend for the page.
Moving Components on the Precision Layout
There are 2 ways to move components on a Precision Layout: using the mouse to click and drag, or using the arrow keys.
Using the mouse to click and drag
When added to a Precision Layout, components show a blue outline, and four squares at the corners. These squares are 'drag handles', which allows you to resize the component.
To move the whole component on the layout, click the middle of the component, hold the left mouse button down, and drag the component to the new location.
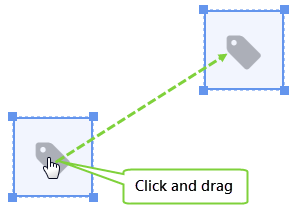
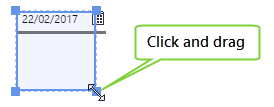
To resize the component, click one of the drag handles and drag it in or out, until you have the desired size.
Using the arrow keys
In Precision Layout, you can move a component by clicking on it and then using the arrow keys. Use together with the Shift key to make larger moves.
Click a component, then:
| Left | Press left arrow key | Moves component 1 pixel to the left |
| Press Shift+Left arrow | Moves component 10 pixels to the left | |
| Right | Press the Right arrow key | Moves component 1 pixel to the right |
| Press Shift+Right arrow | Moves component 10 pixels to the right | |
| Up | Press the Up arrow key | Moves component 1 pixel up |
| Press Shift+Up arrow | Moves component 10 pixels up | |
| Down | Press the down arrow key | Moves component 1 pixel down |
| Press Shift+Down arrow | Moves component 10 pixels down |
Component Properties in Precision Layout
After you have added a component to the Precision Layout, you can reposition it without having to go into the precision layout editor. Component editors have a "Position in Precision Layout" section after the configuration options, which allows you to specify the layer, X-Y coordinates, and exact width and height of the component. The coordinates apply to the top left corner of the component.
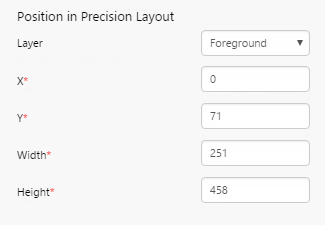
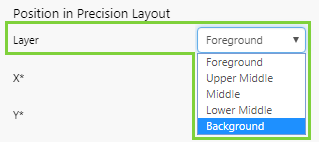
- Layer: Foreground, Upper Middle, Middle, Lower Middle, or Background. When components are overlaid, this determines which component sits in front and which is at the back. If there are more than 3 overlaid components, you will need to play with this setting until you get the desired result.
- X: The distance of the component, in pixels, from the left of the precision layout
- Y: The distance of the component, in pixels, from the top of the precision layout
- Width: The width of the component, in pixels
- Height: The height of the component, in pixels
Tutorial: Creating a Schematic Using Precision Layout
If you're unfamiliar with the process of building pages, read the article Building an Explorer Page.
Precision Layout has no specific parameters. You can begin using this layout by simply dragging the component and dropping it onto the canvas.
In this topic, we'll show you how to use the Precision Layout to design a simple schematic.
Let’s go through this process, step-by-step.
Step 1. Prepare a Studio Page
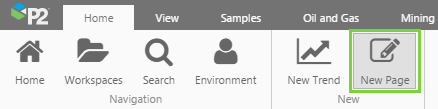
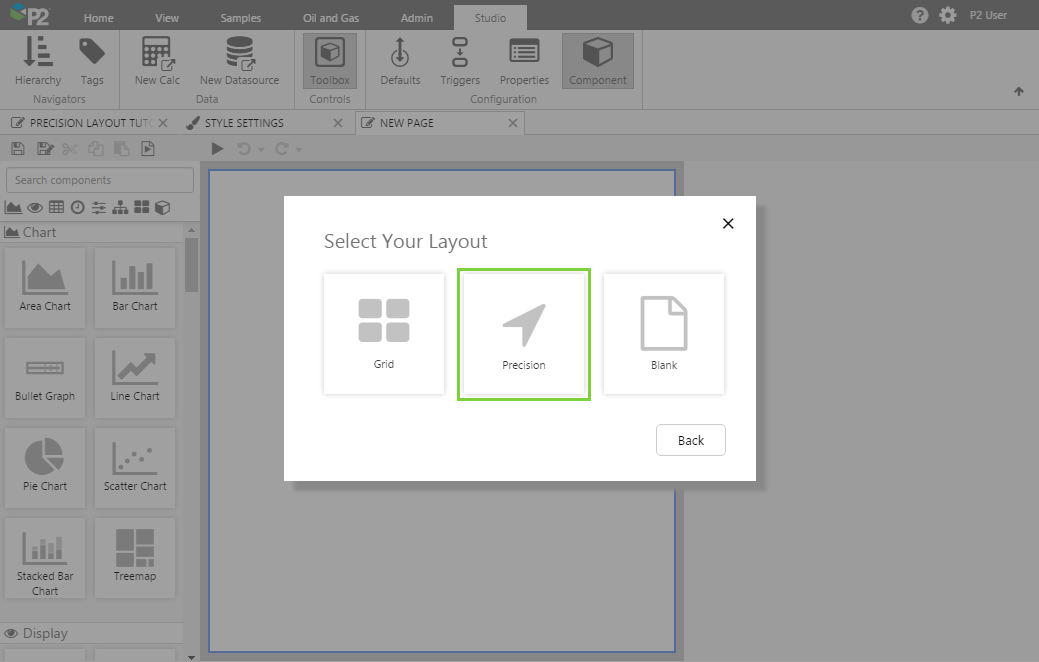
Before you start, click the New Page button on the Home tab of the ribbon. Choose the Precision layout.
Step 2. Add the Text Label for the title
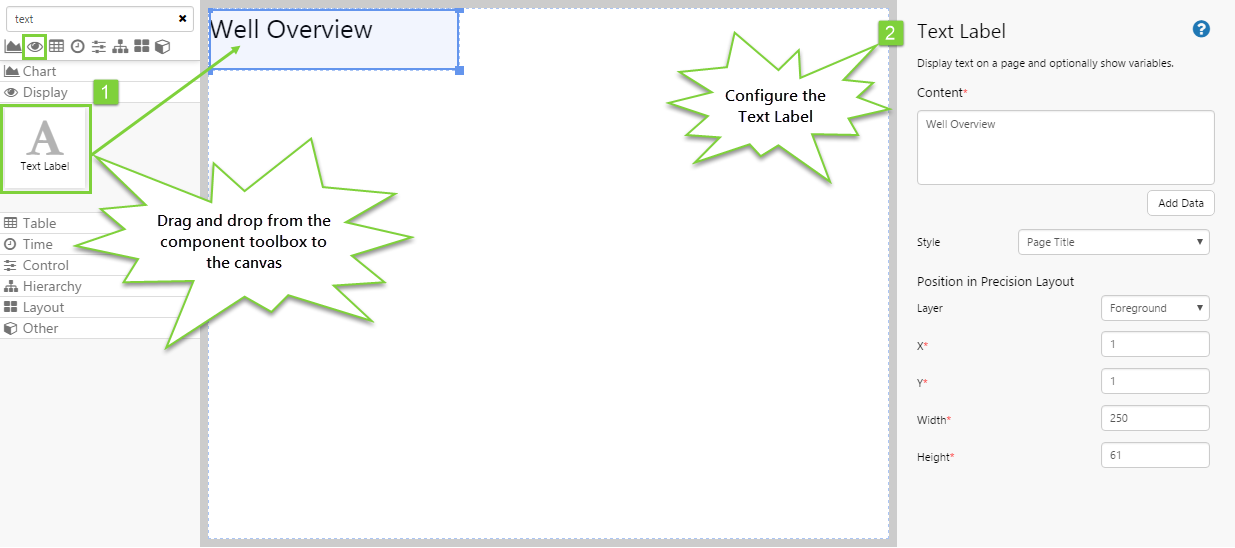
This step adds the title to the page, and is located in the top left corner.
- Drag and drop the Text Label component onto the canvas. The Text Label is in the Display
 group.
 - You will notice that by default it has a square shape, and 4 drag handles will appear in the corners.
- Move the label to the upper left corner, and resize it to the size that you think the text will need.
- In the configuration options, complete the following:
- Content: Well Overview
- Style: Page Title
- Refine the position and size using the Position in Precision Layout options, as follows:
- X: 1
- Y: 1
- Width: 250
- Height: 61
The X and Y options refer to the X-Y coordinates of the top left drag handle of the component.
The Width and Height of the component are specified in pixels.
Step 3. Add the Entity Selector
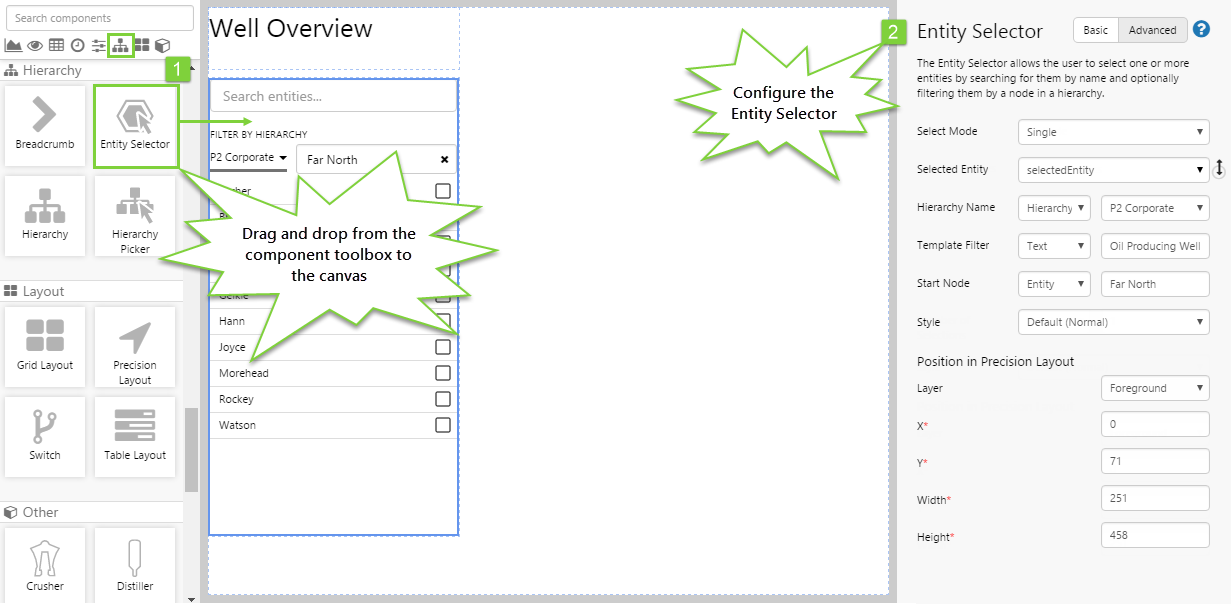
This step allows the user to select an entity, which will drive the data displayed on the schematic.
- Drag and drop the Entity Selector onto the canvas. The Entity Selector is in the Hierarchy
 group.
 - Move it to the left side and resize it so that it's the approximate size you want.
- Click the Advanced button and configure it as follows:
- Select Mode: Single
- Selected Entity: selectedEntity
- Hierarchy Name: (Hierarchy) P2 Corporate
- Template Filter: (Text) Oil Producing Well
- Start Node: (Entity) Far North
- Refine the position and size using the Position in Precision Layout options, as follows:
- X: 0
- Y: 71
- Width: 251
- Height: 458
Step 4. Add the background image
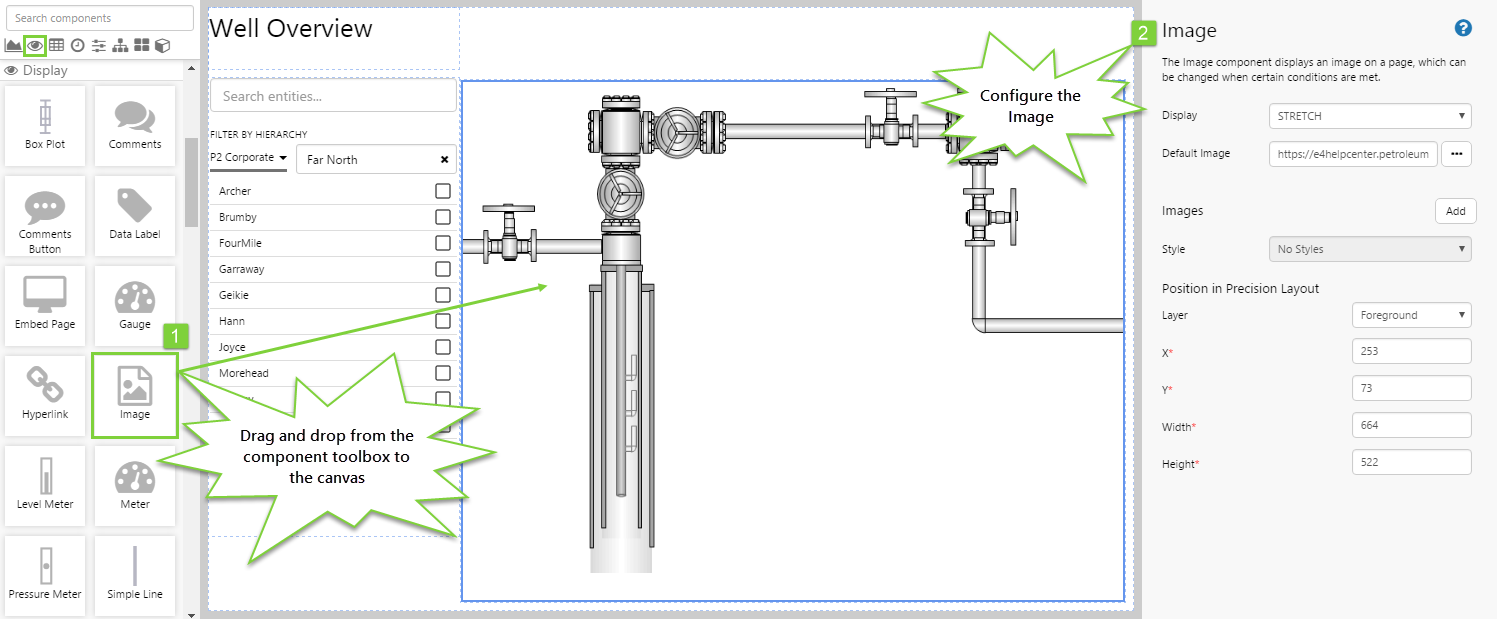
The background image provides the user with the ability to visualise the meaning behind the data.
- Drag and drop the Image component onto the canvas. The Image is in the Display group.
- Move it to the right of the Entity Selector and resize it approximately.
- Configure the Image options as follows:
- Display: Stretch
- Default Image: https://e4helpcenter.petroleumplace.com/help/Images/GasLift.gif
- Refine the position and size using the Position in Precision Layout options, as follows:
- X: 253
- Y: 73
- Width: 664
- Height: 522
Step 5. Add the Date Picker
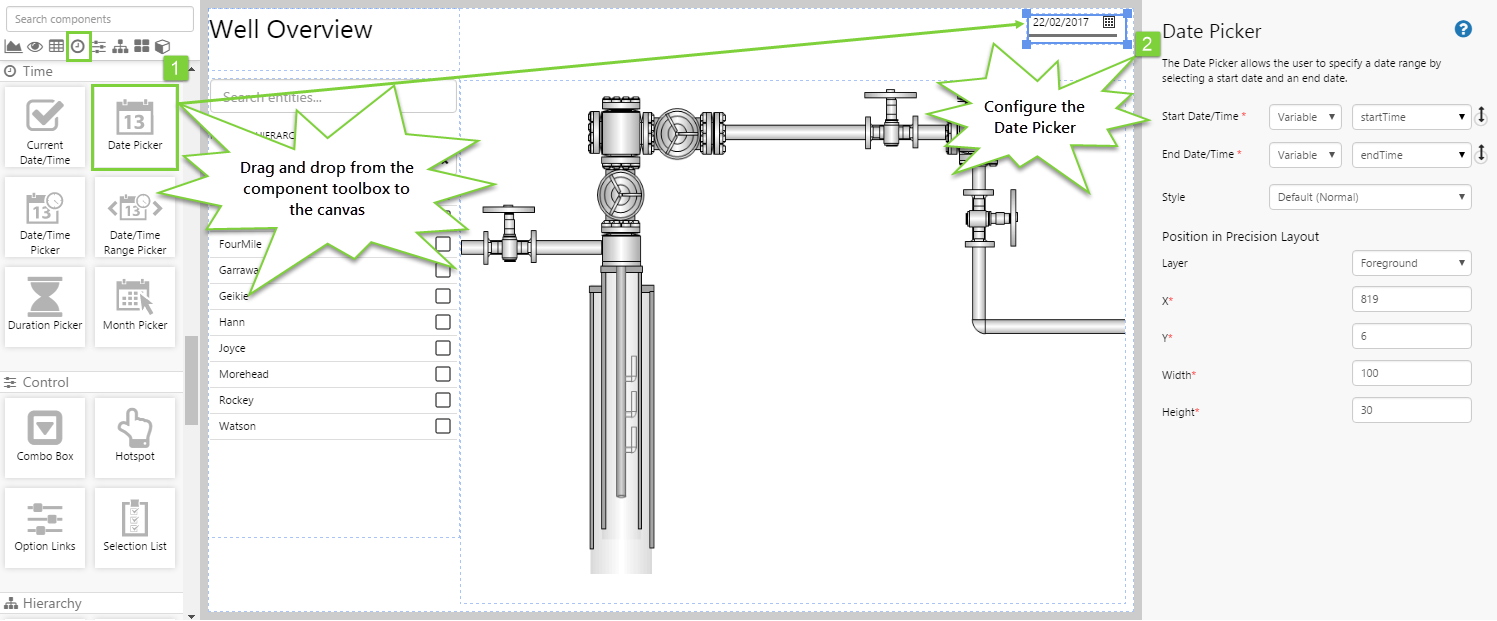
This step adds a date picker to the page, which will drive the data displayed on the schematic.
- Drag and drop the Date Picker component onto the canvas. The Date Picker is in the Time
 group.
 - Move it to the upper right corner and resize it. You don't need to change the configuration options - in the next step we will add defaults for these variables.
- Refine the position and size using the Position in Precision Layout options, as follows:
- X: 819
- Y: 6
- Width: 100
- Height: 30
Step 6. Set the Default Values
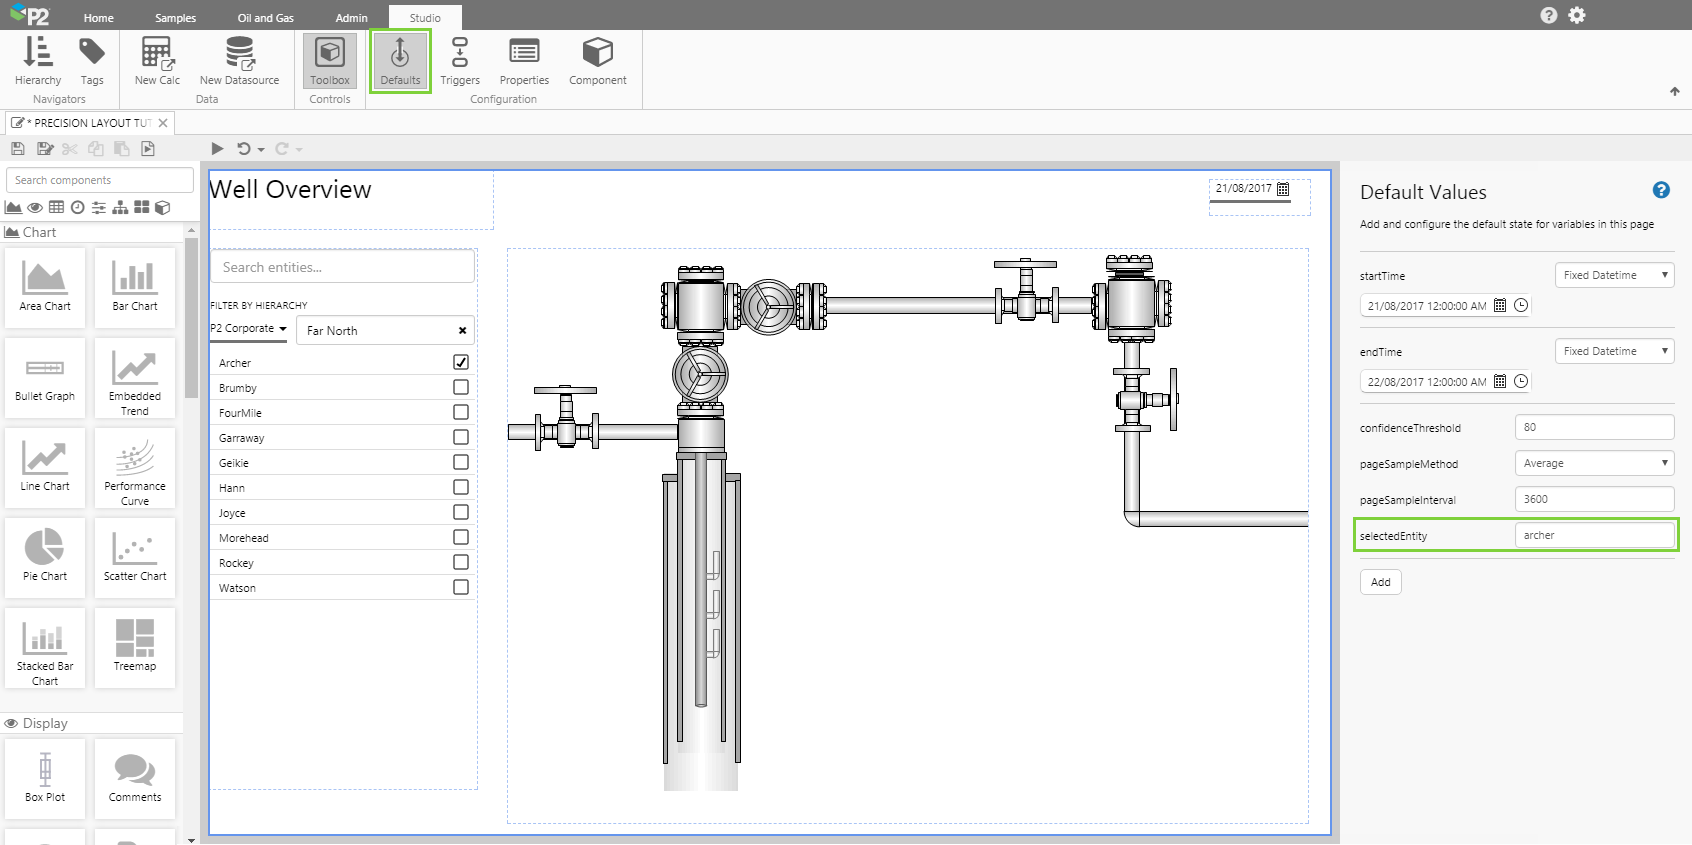
Using Default Values, we can specify the entity that will always be selected by default when the page is loaded.
You should specify the default values for the selected entity so you can see the right data on the page when it first loads.
Let’s change the default data that is displayed. We are interested in the variable, selectedEntity.
- Click the Default Values button on the Studio toolbar.
- For selectedEntity, enter archer.
You should now see the Entity Selector change so that the check box is selected for the default entity, Archer.
In the remaining steps, we will add data at various places on the image.
Step 7. Add a Text Label for the tubing head temperature
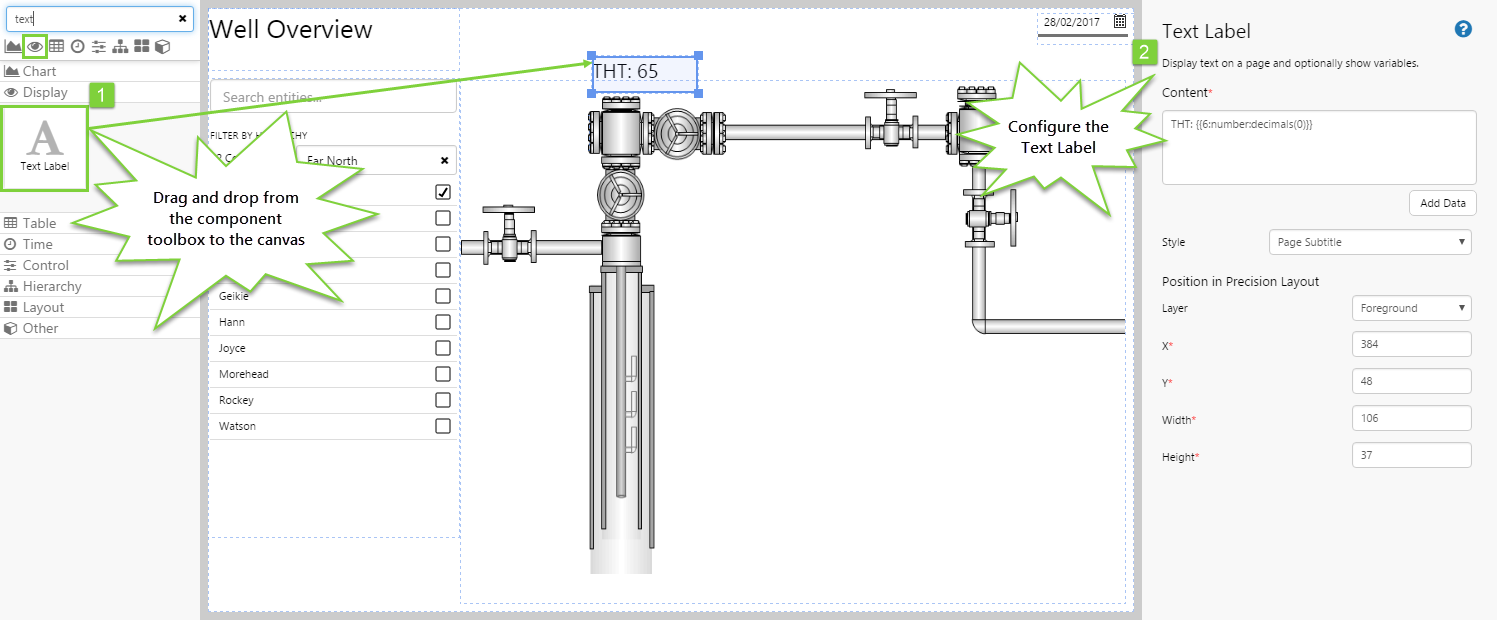
Now we'll start adding the components that will make our schematic show us relevant data. We'll add an advanced Text Label that is also configured to show the data for the Tubing Head Temperature of the selected entity.
- Drag and drop the Text Label component onto the canvas. The Text Label is in the Display group
- Position it so that it sits above the tubing head in the background image, and resize it appropriately.
- In the configuration options for the Text Label:
- [A] In the Content box, type: THT:
- [B] Click the Add Data button.
- [C] In the callout, choose the Type of Number (we want to display a number).
- [D] Click the Data drop-down, and choose the Attribute
 tab in the Data Selector. For Template choose Oil Producing Well, and for Attribute choose THT.
TOP TIPClick the Preview button to check that you are getting data. If the preview window is blank, you may have filled in a parameter incorrectly.
- [E] Back in the callout, choose a Format of Decimals.
- [F] In the Decimals field, specify 0 decimal places.
- [G] Click the Add button to add the data to the Text Label. The Content will now look something like, THT: {{6:number:decimals(0)}}

- Refine the position and size of the Text Label using the Position in Precision Layout options, as follows:
- X: 384
- Y: 48
- Width: 106
- Height: 37
Step 8. Add a Text Label for the tubing head pressure
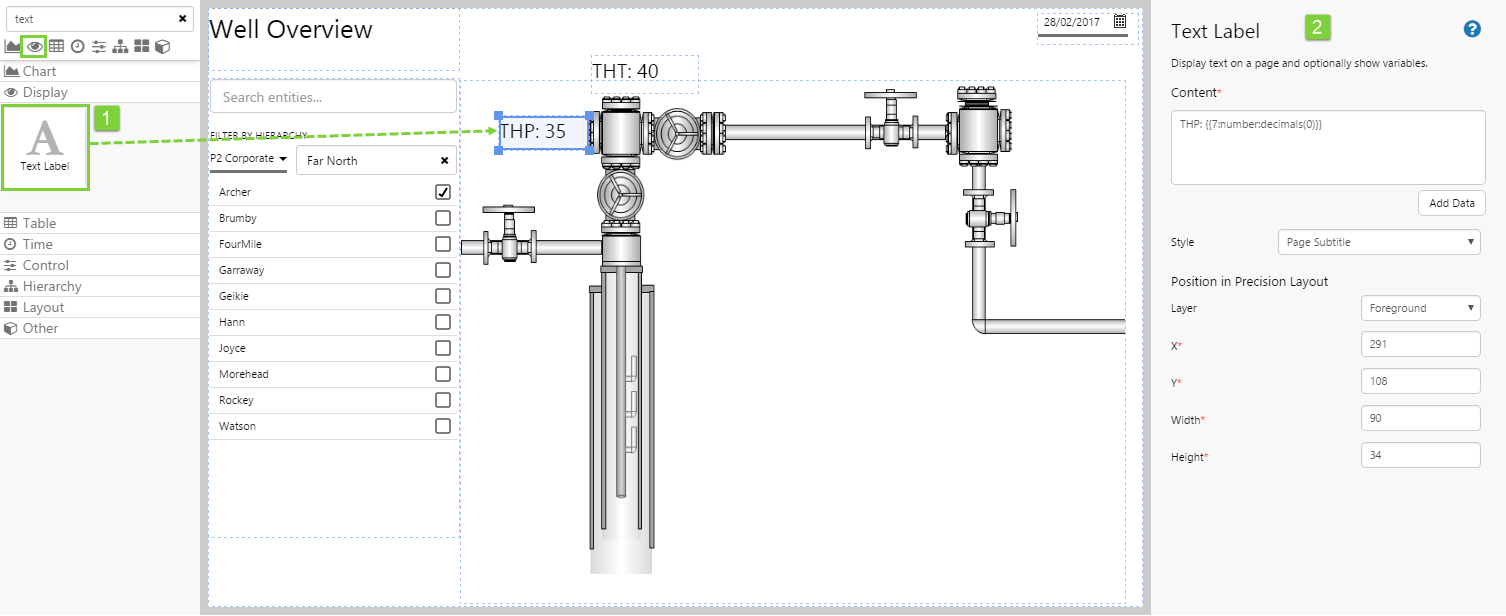
The actual value of the tubing head pressure is displayed by a Data Label.
- Drag and drop the Text Label component onto the canvas. The Text Label is in the Display group
- Position it so that it sits above the tubing head in the background image, and resize it appropriately.
- Configuration of this label is very similar to the previous step:
- In the Content box, type: THP:
- Click the Add Data button.
- In the callout, choose the Type of Number (we want to display a number).
- Click the Data drop-down, and choose the Attribute tab in the Data Selector. For Template choose Oil Producing Well, and for Attribute choose THP.
Click the Preview button to check that you are getting data. If the preview window is blank, you may have filled in a parameter incorrectly.
- Back in the callout, choose a Format of Decimals.
- In the Decimals field, specify 0 decimal places.
- Click the Add button to add the data to the Text Label. The Content will now look something like, THP: {{7:number:decimals(0)}}
- Finally, refine the position and size of the Data Label using the Position in Precision Layout options, as follows:
- X: 291
- Y: 108
- Width: 90
- Height: 34
Step 9. Manipulating Layers
One of the most useful features of Precision Layout is the ability to specify the order in which overlaid objects appear. So you can specify which component sits in the front, and which one sits at the back. This is also referred to as z-ordering or z-layering.
Click the THP label, and change the Layer to Background.
Observe what happens - the content of the label disappears, but you can still see its outline. This is because it is now behind the image.
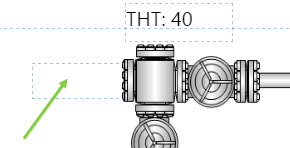
If you try to click the label again, you will notice that you can't select it - clicking only allows you to select the uppermost layer.
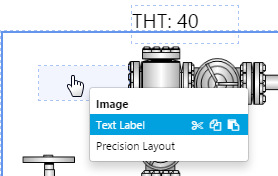
To select a component that is in one of the lower layers, right-click and choose it from the menu. In the menu, as you hover over the options, watch how the highlighted section on the canvas corresponds to the layer you are hovering over in the menu. When you hover over Image, the image layer is highlighted in blue; when you hover over Text Label, the label is highlighted.
Keep changing the layers so you can understand how it works.
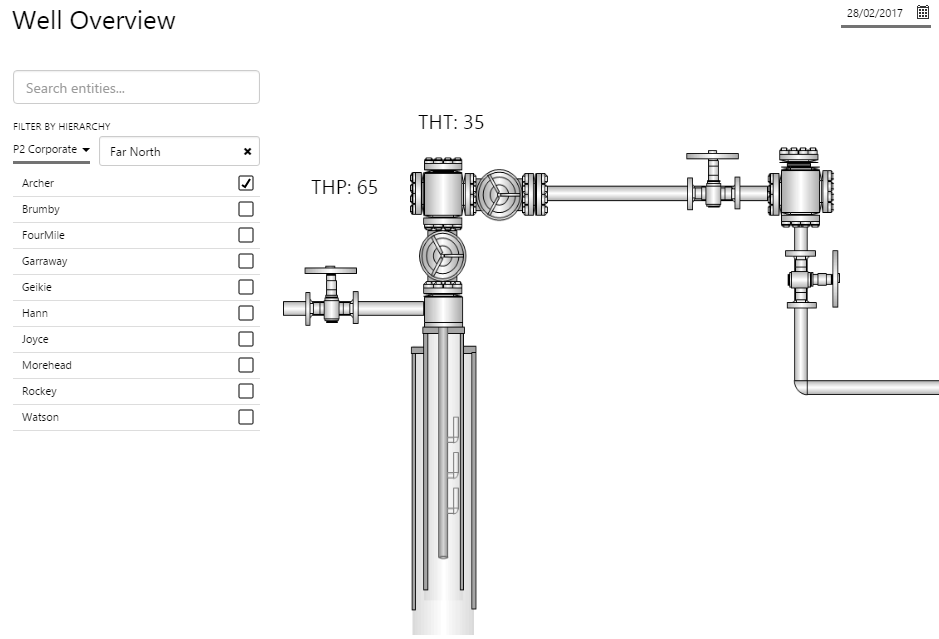
Step 10. All done!
Congratulations! You now have a schematic page with data that will update according to the selected date and entity.
- Click the preview
 button on the Studio toolbar to see what your page will look like in run-time.
 - Choose different dates and entities and observe the changes in the data.
![]() Don't forget to save your page!
Don't forget to save your page!
Release History
- Precision Layout 4.5.2 (this release)
- 2 new layers available (Upper Middle and Lower Middle)
- Precision Layout 4.4.4
- Added layering within component editors
- Precision Layout 4.4.1
- Precision Layout 4.4.0
- Precision Layout 4.3.2