ON THIS PAGE:
The Embedded Trend component includes most of the functionality of the Explorer Trend. It is used when a trend is needed on an Explorer page, and can be opened as a full page trend when access to all of the trend features is required.
With embedded trends, traces can be added to the trend in the page configuration or after a page is loaded by:
- Dragging and dropping time series data labels from a page onto the embedded trend
- Dragging and dropping tags and attributes from a Navigator onto the embedded trend
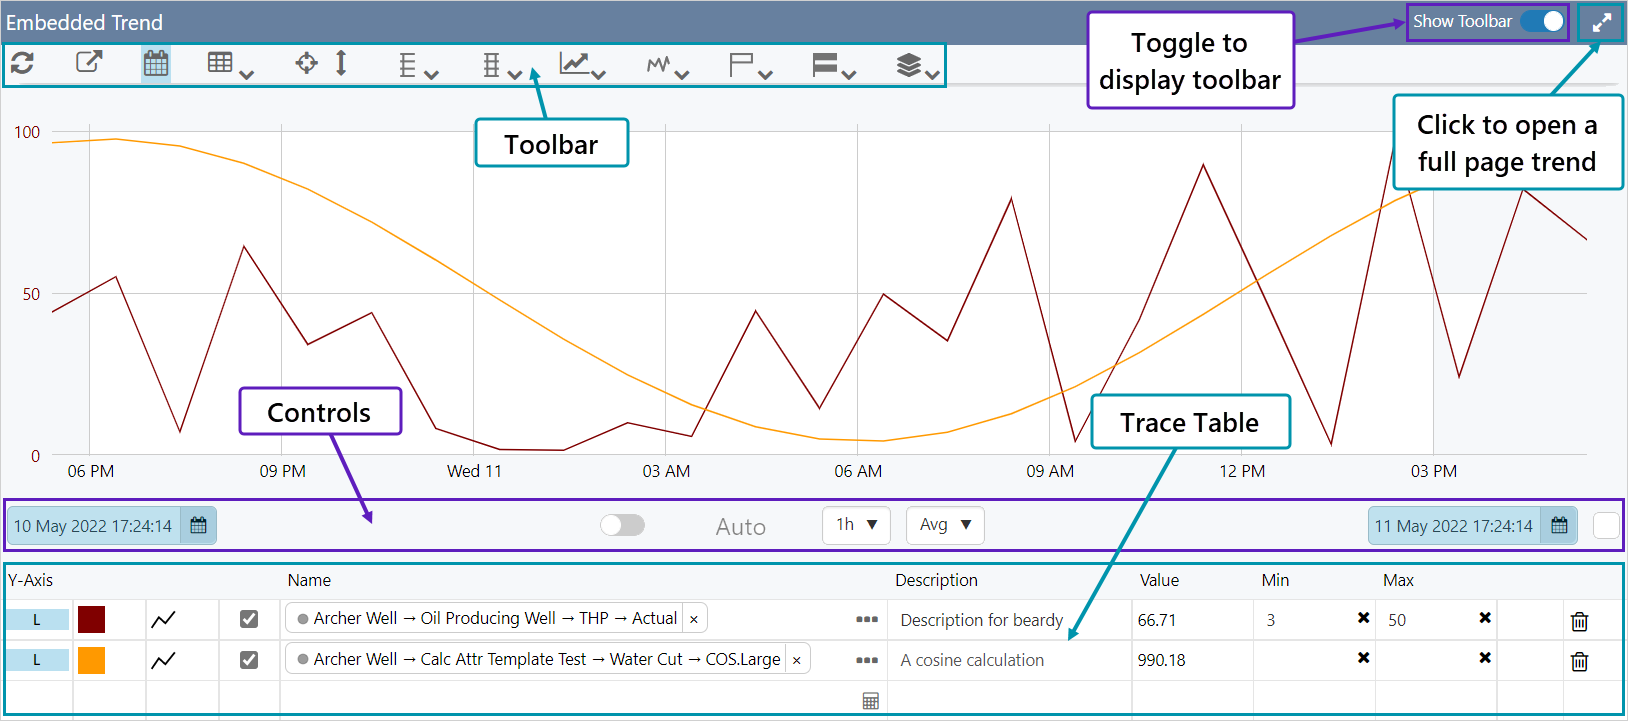
An Embedded Trend
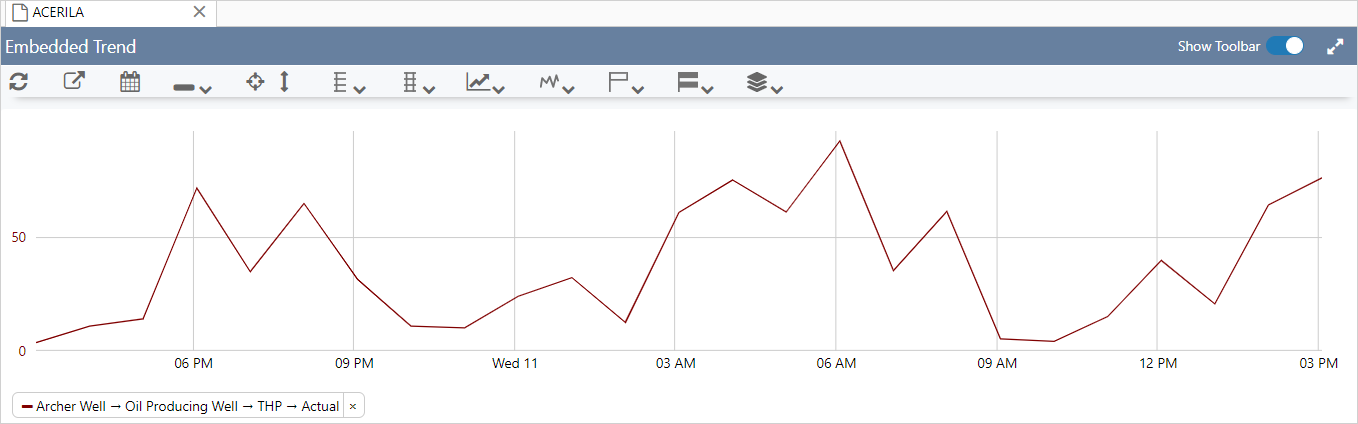
Embedded trend with traces:
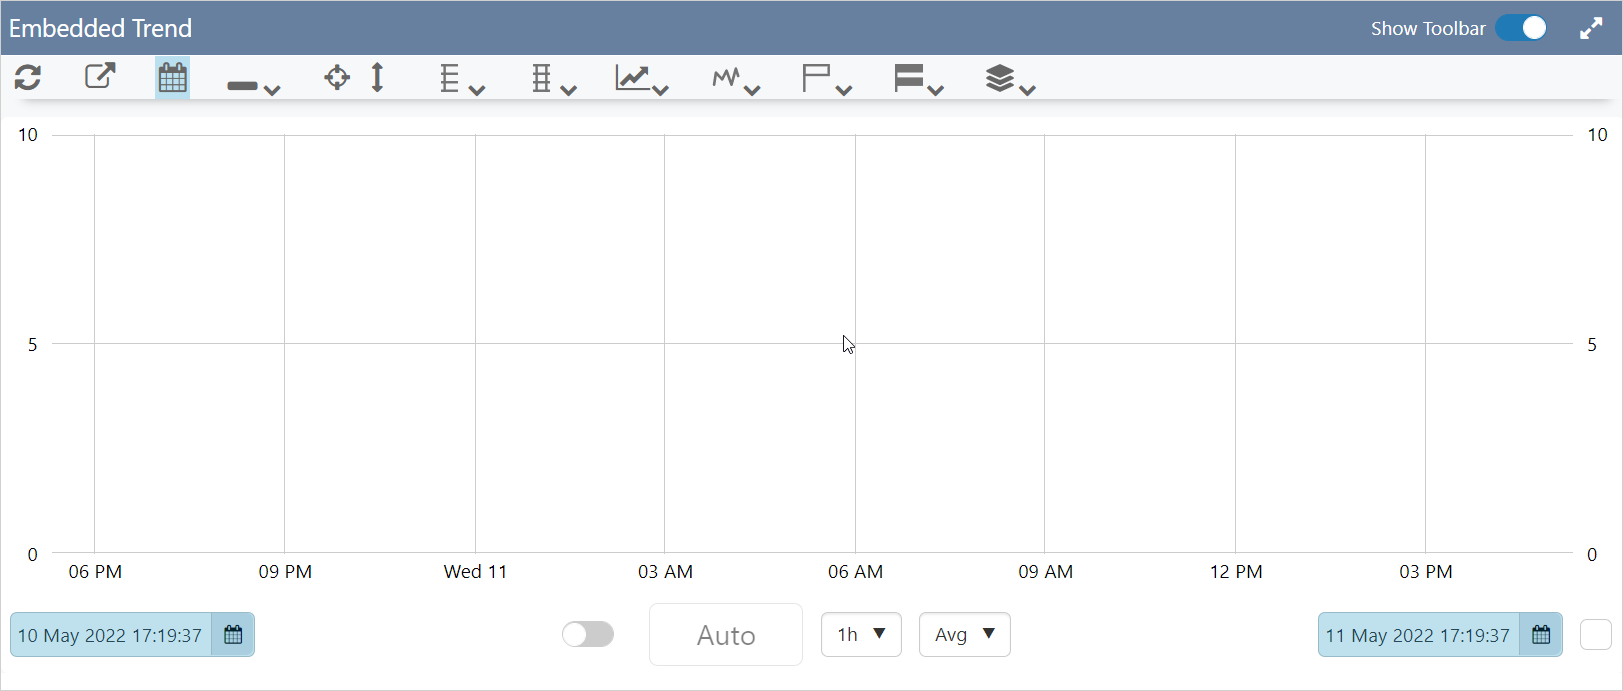
Embedded trend with no preconfigured traces:
The Toolbar
The buttons on the toolbar can be used to manipulate the trend.
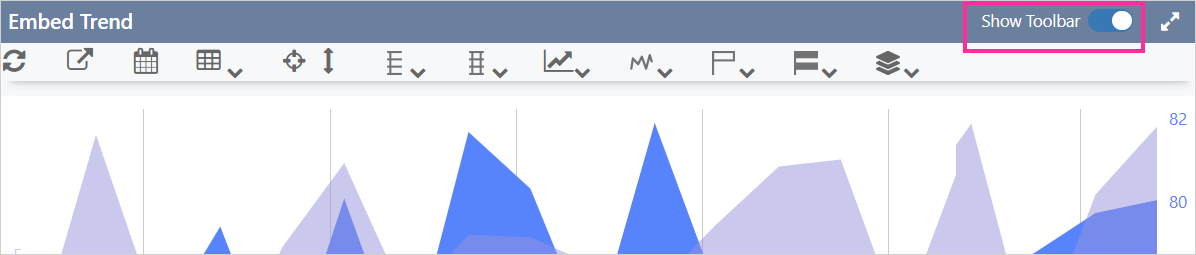
Display or hide the toolbar by turning on/off Show Toolbar.
| Select the buttons on the toolbar to: | ||
| Refresh | Update the data points on the trend. | |
| Export CSV | Export the trend data to a .csv file. | |
| Controls | Show/hide the trend controls. | |
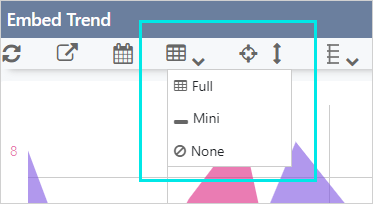
| Trace Table | Display the full, mini or no trace table. Open the full page trend to see all of the trace table columns. | |
| Zoom | Aactivate/deactivate zoom mode. | |
| Auto Range | Update the minimum and maximum y-axis values. | |
| Y Scale | Choose log or linear plot type. | |
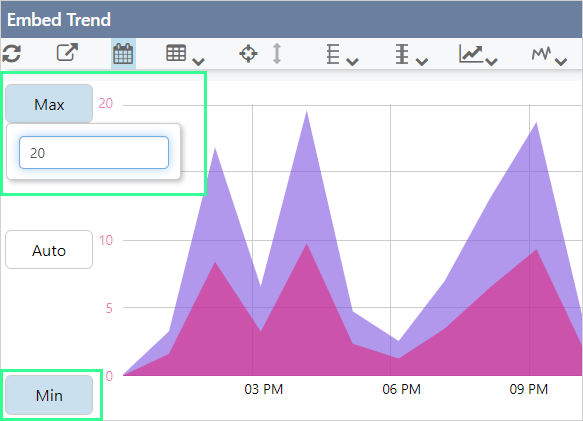
| Y-axis |
Display separate, shared or multiple y-axes. When shared is selected the min and max for the y-axis can be set.
|
|
| Plot Layout | Display single or stacked charts. | |
| Plot Mode | Choose timeseries or XY plot mode. | |
| Hairline | Choose single, dual or multiple hairlines. | |
| Hairline View | Choose what data to display in the hairline information box. | |
| Layers | Choose to display/hide comment and case markers on the trend. | |
The Trace Table
The trace table contains the details about traces that are plotted on the trend. With an embedded trend, the trace table can be a full or mini version, or not displayed at all.
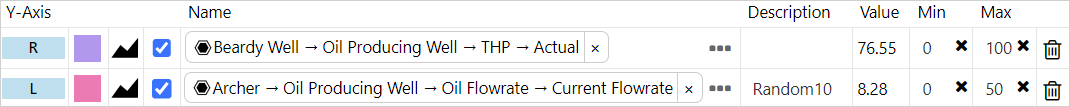
The embedded trend full trace table shows the mobile view of the trace table and in this view not all columns are displayed. Open the full page trend to see the complete trace table.
In the mini version, only the trace names are displayed. Clicking on a trace name will display the trace at the front of the trend, and the ![]() on the right side can be used to delete the trace.
on the right side can be used to delete the trace.
![]()
Adding Traces
Time series data can be added to an embedded trend from the Tags or Hierarchy Navigators, or from a data label on the same page or a different page.
Drag and drop attributes from the Attribute Panel (accessed via the Hierarchy Navigator), or tags from the Tags Navigator, to add the attribute or tag to the embedded trend.
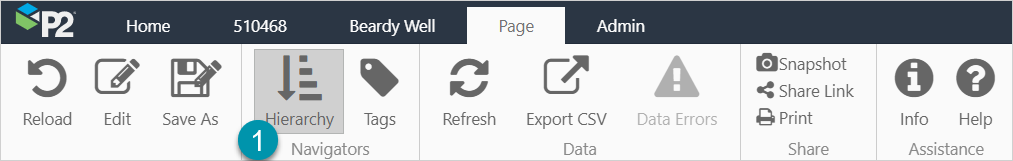
1. On the Page ribbon tab, click Hierarchy to open the Hierarchy Navigator.
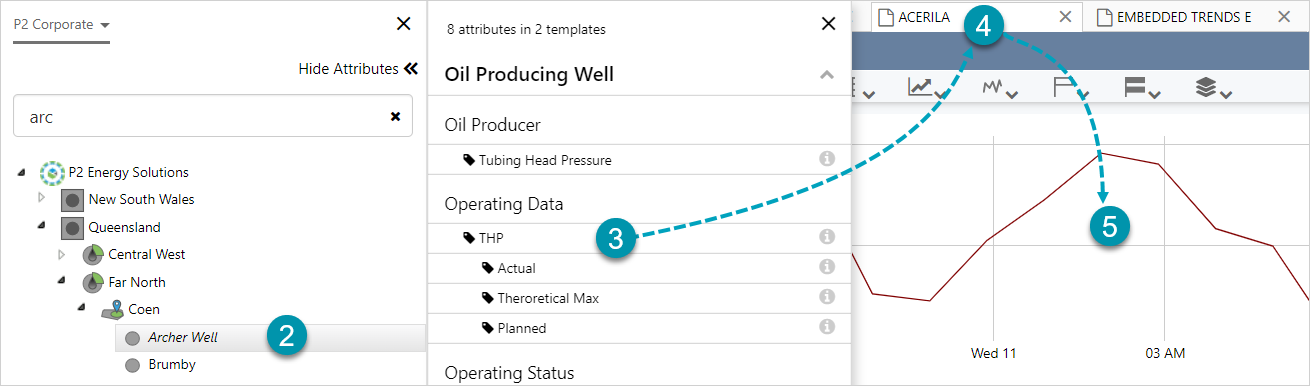
2. Select a hierarchy and an entity.
3. Open the Attributes Panel and click on the required attribute.
4. Dragging the selected attribute, hover over the page name to select the page.
5. Drop the attribute value onto the embedded trend and close the hierarchy navigator.
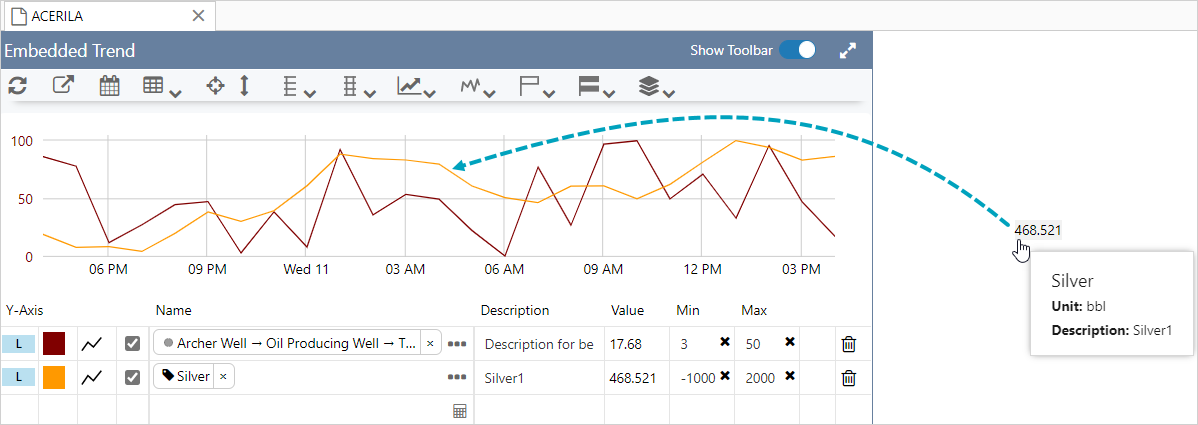
Selected attribute on the embedded trend:
Follow the same steps using the Tags Navigator, to add a tag to an embedded trend.
From Data Labels
A data label's value can be added to the embedded trend, if the value is a tag or an attribute.
Drag and drop the data label onto the embedded trend, and the value will be added as a trace line. The data label can be on the same page or a different page.
Removing Traces
Remove a trace by clicking on the bin ![]() icon on the right side of the trace on the full trace table or
icon on the right side of the trace on the full trace table or

the ![]() symbol beside a trace on the mini trace table.
symbol beside a trace on the mini trace table.
![]()
Release History
- Using an Embedded Trend 4.10.2 (this release)
- More of the full page trend functionality included
- Mini trace table option
- Toggle toolbar display
- Using an Embedded Trend 4.5.5
- Using an Embedded Trend 4.5.4
- You can now drag a data label from another page onto the embedded trend
- Labels for ad hoc calculations can be dragged onto an embedded trend (as well as for Tags and Attributes)
- Using an Embedded Trend 4.5.0