ON THIS PAGE:
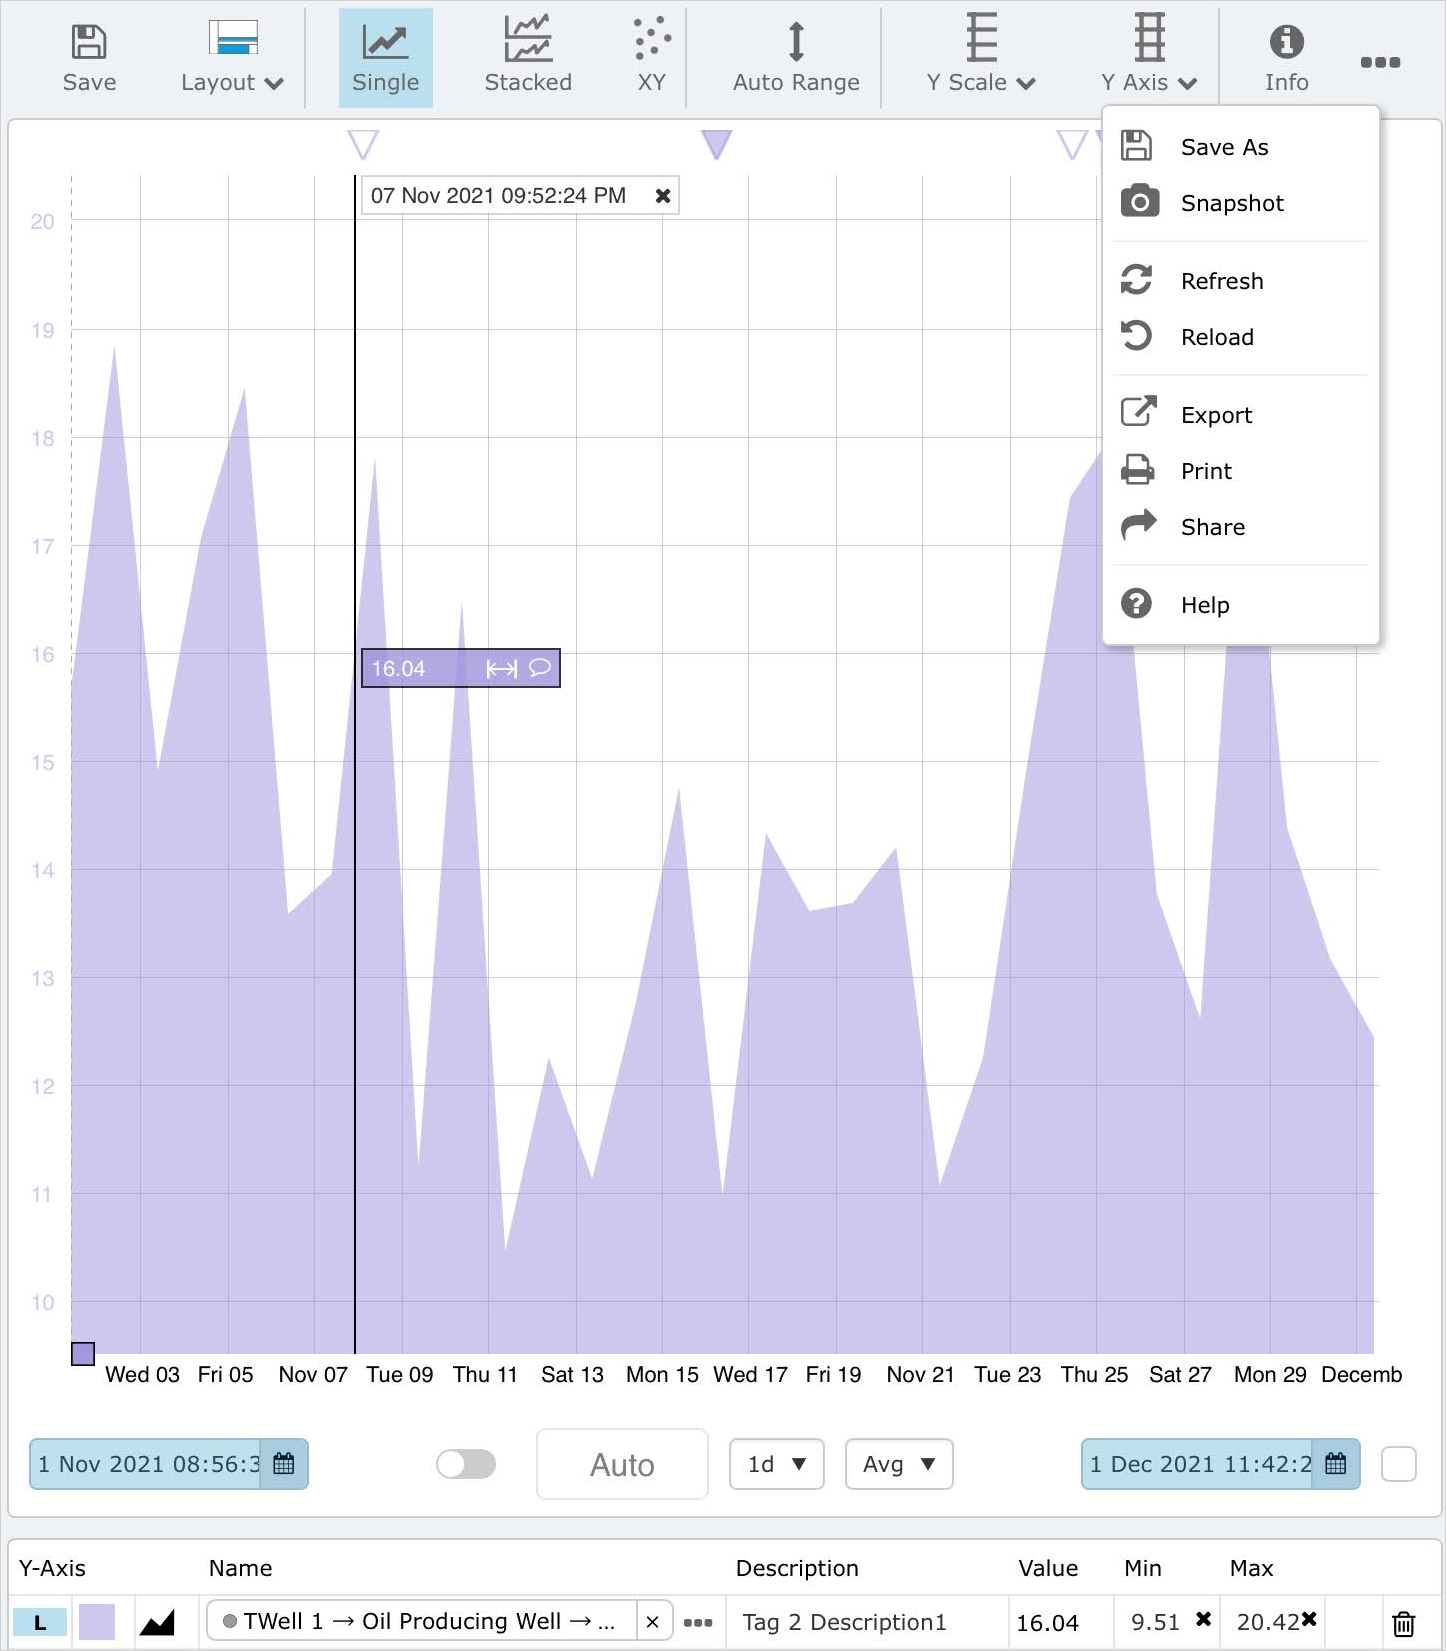
The Trend Toolbar is active when the currently selected tab in the display area is a ![]() Trend. Use the buttons on the toolbar to manipulate the trend.
Trend. Use the buttons on the toolbar to manipulate the trend.
![]()
 |
Save | Click the Save button and select either Save, Save As or Snapshot options.
Note: You need Workspaces Edit privileges for this trend's workspace, to save the trend. |
 |
Save Metadata |
Save the tag metadata values for all tags and attribute values that are displayed in the trace table, including Min, Max, Units and Description. Note: You need Tag Edit privileges to save the metadata. |
 |
Refresh | Click and select either Refresh Data or Reset Trend.
|
 |
Share | Click to access either the Share Link or Print options.
|
 |
Export CSV |
Export the trend's data to a .csv file for downloading. Note: Read more about the trend's data in the Trend Controls topic. Time range, sample method, and sample interval all determine what data is fetched. This is the data that is then exported. So if, for example, the Adaptive Raw sample method is selected, the trend will only export the rendered data, not all of the raw data. |
 |
Analysis | Opens the Analysis panel which gives the options of creating and visualizing complex models directly against any timeseries data in the system; and saving a defined period of time as a Time Window. |
 |
Time Windows | Toggle button to show/hide the Time Windows table; only displays when the Trace Table is visible. |
 |
Range Selector | Toggle to show/hide the Range Selector. Hiding the Range Selector allows more space for the Trace Window. |
 |
Controls | Toggle to show/hide the Trend Controls (date selectors, sample method and sample interval). Hiding the Trend Controls allows more space for the Trace Window. |
 |
Trace Table | Toggle to show/hide the Trace Table, which allows more space for the Trace Window. |
 |
Zoom | Toggle to activate/deactivate the Zoom mode. Click |
 |
Y Range | Select when the y-axis is in shared mode to display editable Min and Max buttons beside the y-axis. The Auto button resets the min and max values so all data points are visible. |
 |
Auto Range | Click to automatically update the minimum and maximum y-axis values so all trace data points are visible on the trend. Applies only to the current data on the trend and when separate y-axis are selected. Refresh the trend to undo auto range adjustments. |
 |
Y Scale | Select and choose Log or Linear.
Note: If a trend includes data points of zero, then instead of showing an error for the Log Scale Type, Explorer plots a point that is close to zero, and displays this as zero. |
 |
Y Axis | Click and select Separate, Shared or Multiple.
|
 |
Plot Layout |
Select either Single Chart or Stacked Chart.
|
 |
Plot Mode | Choose either Time Series, Duration or XY.
|
 |
Hairline | Choose the number of hairlines allowable on the trend (single, dual, multiple or none). |
 |
Hairline View | Choose the data to display in the hairline information box (value and timestamp, timestamp, value or none). |
 |
Layers |
Select to display triangular comment, and square case, markers on the trend.
Hover over a marker to display a tool tip, and click on a marker to open the case or comment in the Explore panel. |
 |
Info | Click to open the Display Information panel for the trend. |
 |
Help | Open the Trends menu page in the P2 Explorer Help Center. |
Trend on a Tablet
The trend toolbar has been modified to fit on a tablet's smaller screen.
Release History
- Trend Toolbar (this release, 4.10.1):
- Save tag metadata
- Trend on a tablet
- Layers option includes cases and comments