Overview
The Data Label displays a single numeric data value, and is often used on schematics when you want to display the value of a single entity attribute.
The following diagram shows a Data Label being configured:
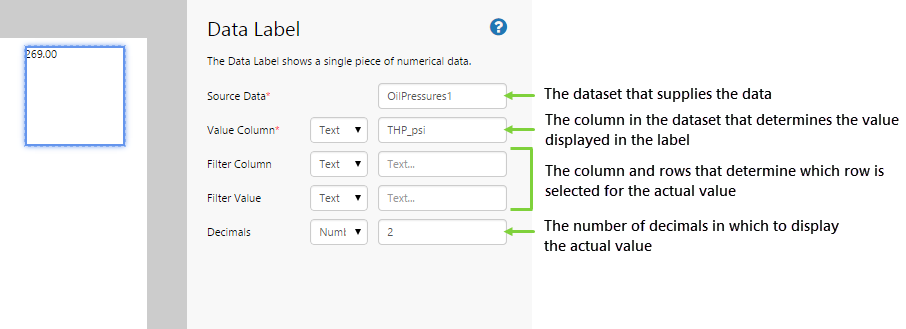
| Source Data: | The dataset from which the values are obtained. |
| Value Column: | The column in the dataset that provides the actual value of a data point. This must contain a numeric value. If it contains anything other than a number, nothing will be displayed. This is used in conjunction with the Filter Value. |
| Filter Column: | The column of the dataset that determines the value that will be displayed. |
| Filter Value: | The row of the dataset that provides the value that will be displayed. |
| Decimals: | The number of decimal points in which the value will be shown. |
Tutorial
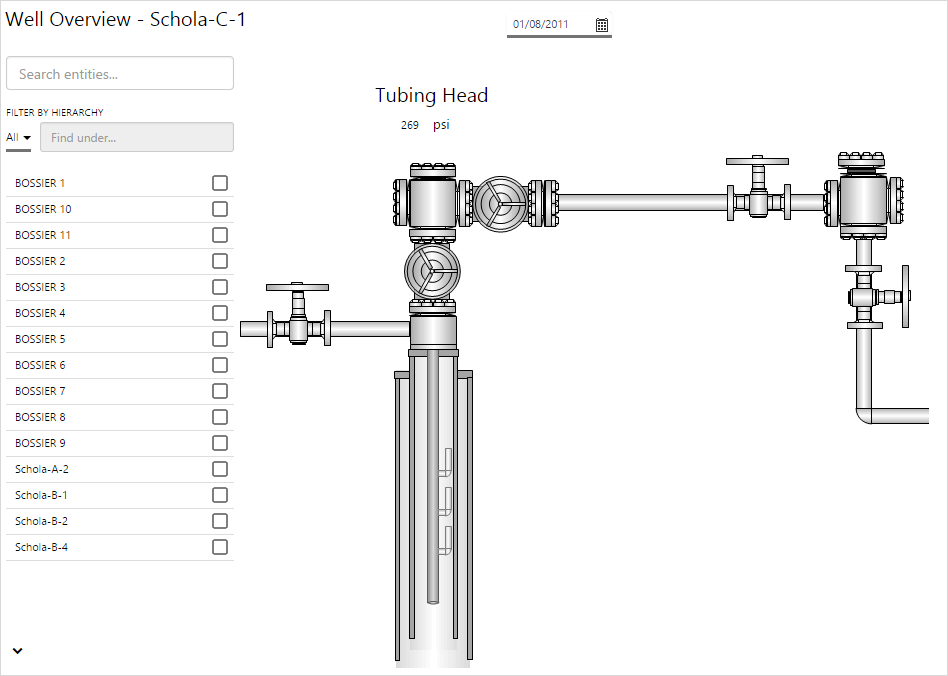
The Data Label is a useful component in schematic style pages. In this topic, we’ll show you how to use the Data Label to display the tubing head pressure in a simple schematic. The THP also changes depending on the selected entity and date.
Let’s look at how we’re actually going to do this, step-by-step.
Step by Step: Creating a Schematic Using Precision Layout
Before you start, open a new tab in Explorer and click the “Create a New Page in Studio Mode” thumbnail. Choose the Precision Layout.
If you have access to the training environment, you can follow the steps exactly as outlined here. Otherwise, you will need to adjust the configuration to suit your data.
Step 1. Add the Text Label for the title
This step adds the title to the page, which will automatically update depending on which entity the user selects.
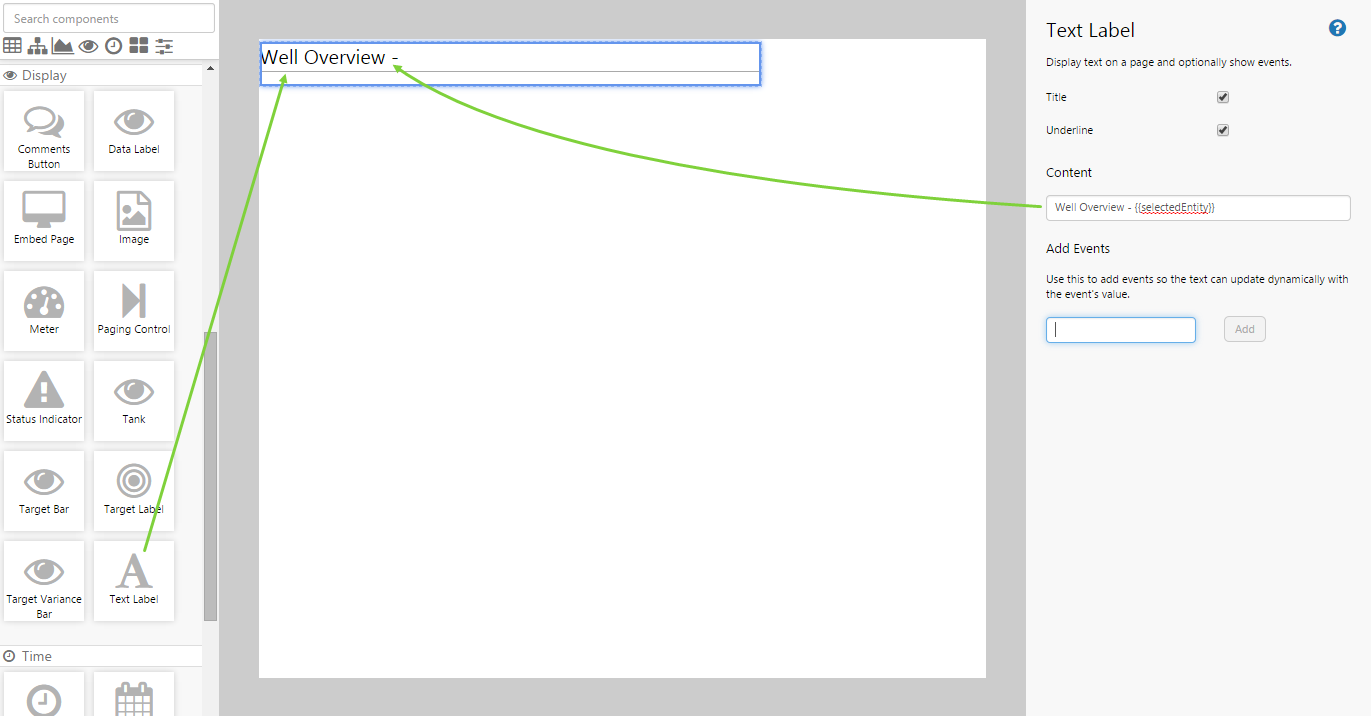
- Drag and drop the Text Label component onto the canvas.
- You will notice that by default it has a square shape, and 4 drag handles will appear in the corners.
- Move the label to the upper left corner, and resize it to the size that you think the text will need.
- In the configuration options, complete the following:
- Content: Well Overview – {{selectedEntity}}
- Select the Title check box
- Select the Underline check box
Step 2. Add the Date Picker
This step adds a date picker to the page, which will drive the data displayed on the schematic.
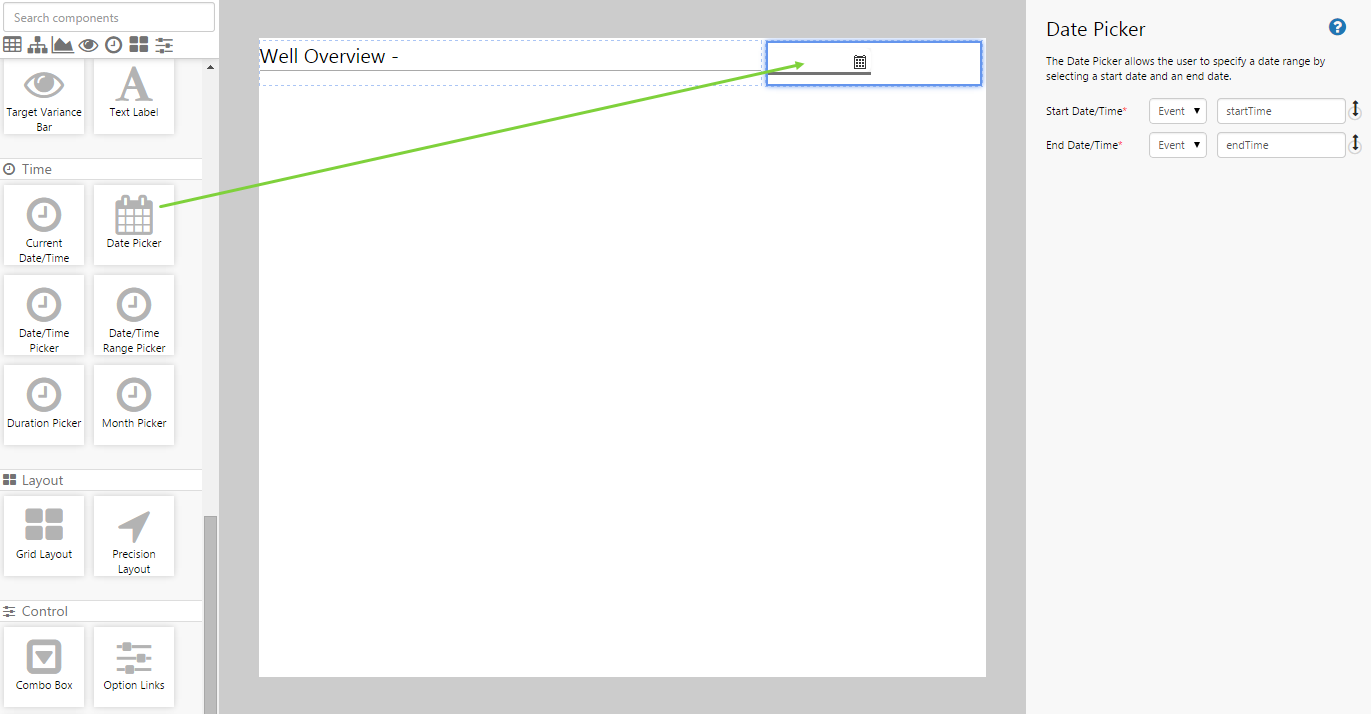
- Drag and drop the Date Picker component onto the canvas.
- Move it to the upper right corner and resize it appropriately.
You don’t need to change the configuration options if you don’t want to – later we will add event defaults for these.
Step 3. Add the Entity Selector
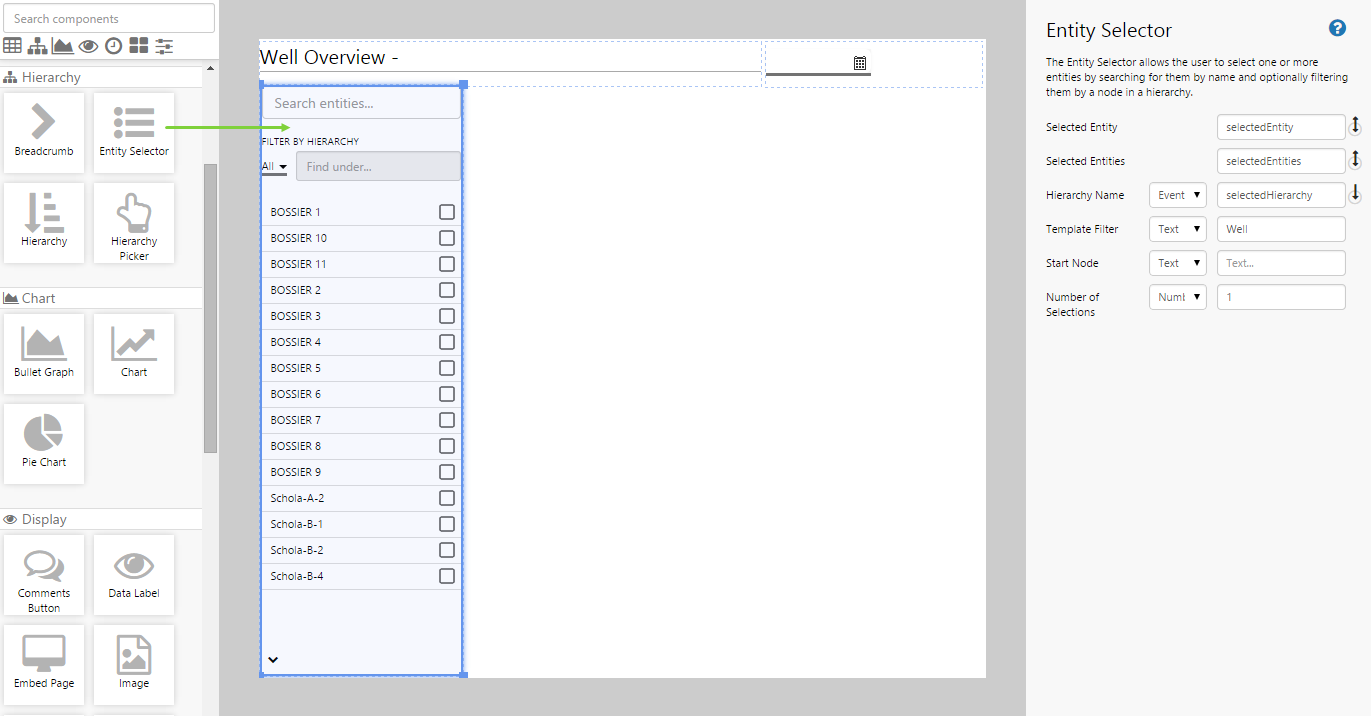
This step allows the user to select an entity, which will drive the data displayed on the schematic.
- Drag and drop the Entity Selector control onto the canvas.
- Move it to the left side and resize it appropriately.
- Configure it as follows:
- Selected Entity: selectedEntity
- Template Filter: (Text) Well
- Number of Selections: 1
You don’t need to change the Selected Entities and Hierarchy Name configuration options if you don’t want to – we will add event defaults for them later.
Step 4. Add the data
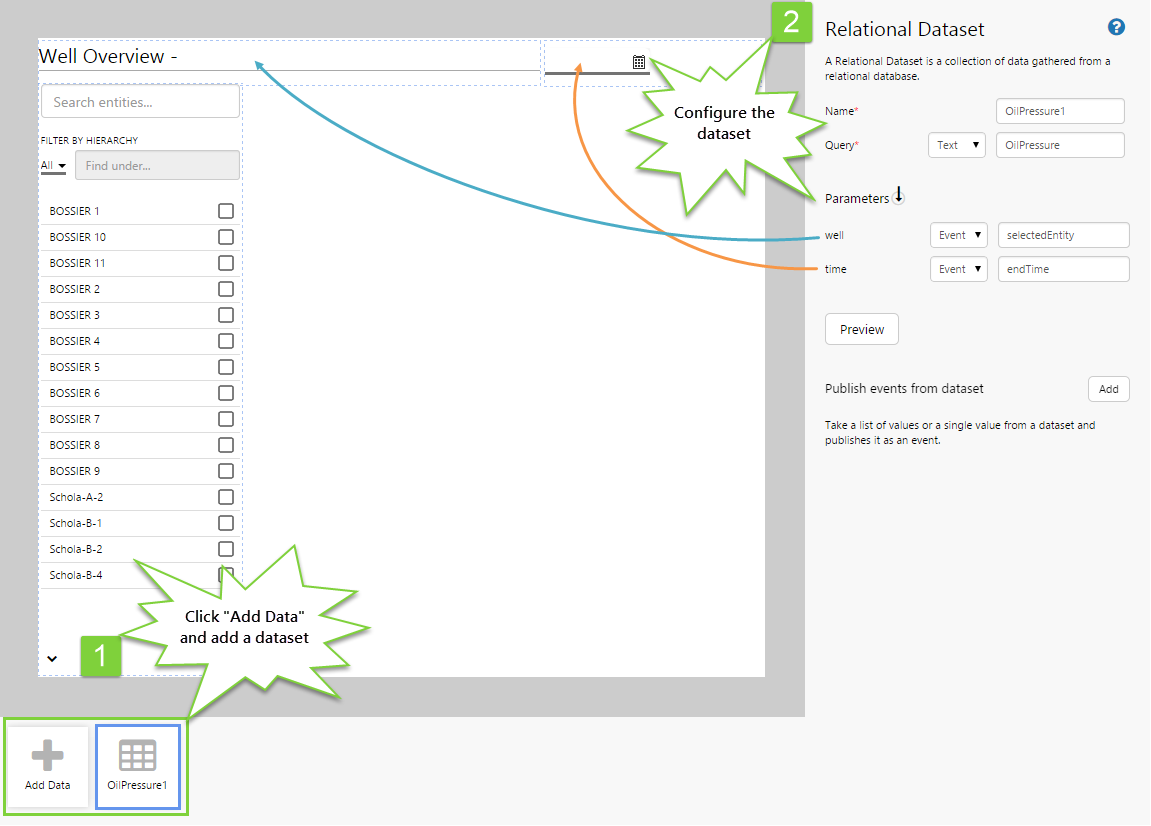
Before we can display the data on the page, we need to add the source data.
- Below the canvas, click the button labelled "Add Data".
- Choose the data you are going to use. For this tutorial, we are using a dataset called “OilPressure”.
- In the configuration options, specify the following:
- Name: OilPressure1 (this is automatically added)
- Query: OilPressure (this is the query in P2 Server that is being used to return the data)
- Parameters – well: specify an event named selectedEntity
- Parameters – time: specify an event named endTime
These events will feed the other components on the page to display values for the selected date and entity.
Step 5. Add the background image
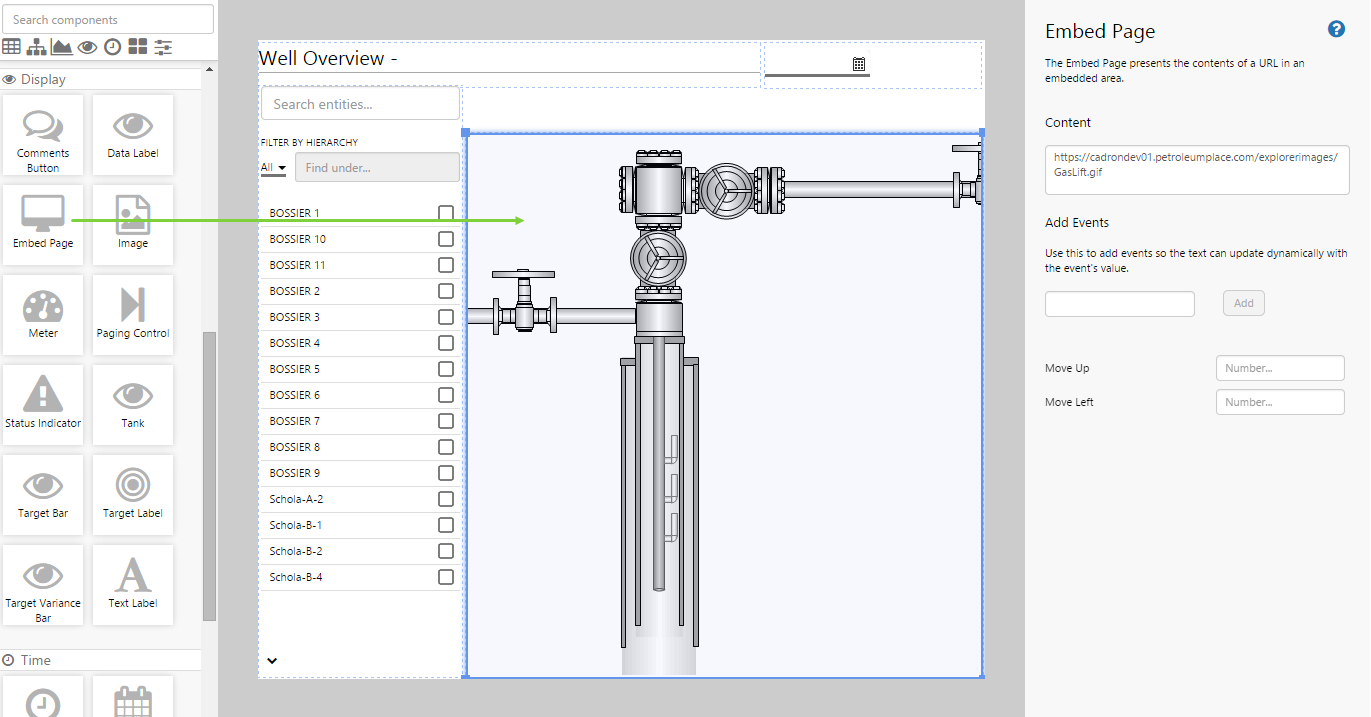
The background image provides the user with the ability to visualise the data. The image must be stored on a secure website (using https) accessible over the network.
- Drag and drop the Embed Page component onto the canvas.
- Move it to the right of the Entity Selector and resize it appropriately.
- In the Content box, type the full URL of the image e.g. https://cadrondev01.petroleumplace.com/explorerimages/GasLift.gif
Step 6. Add the Text Label for the tubing head
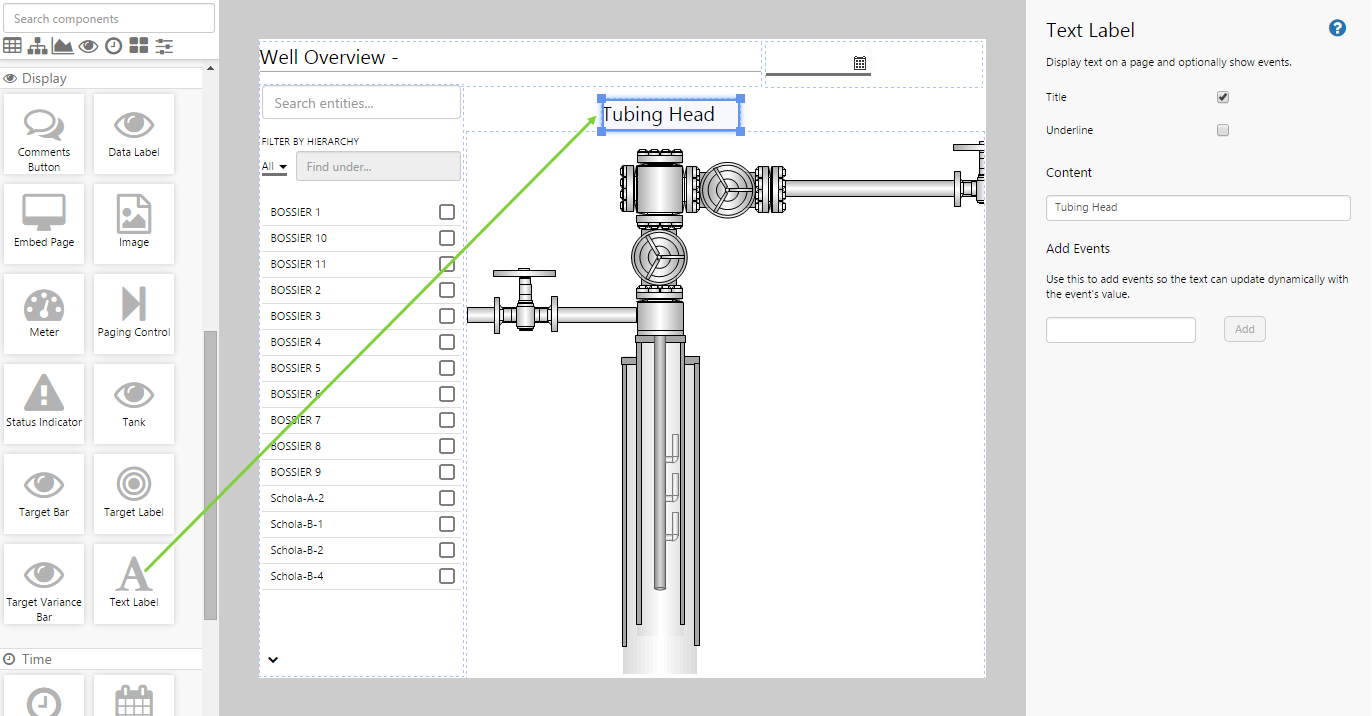
Now we’ll start adding components that will make our schematic show us relevant data. A data point on its own is confusing if it’s not labelled, so let’s add a label first.
- Drag and drop the Text Label component onto the canvas.
- Position it so that it sits above the tubing head in the background image, and resize it appropriately.
- In the configuration options, complete the following:
- Content: Tubing Head
- Select the Title check box
Step 7. Set the event defaults
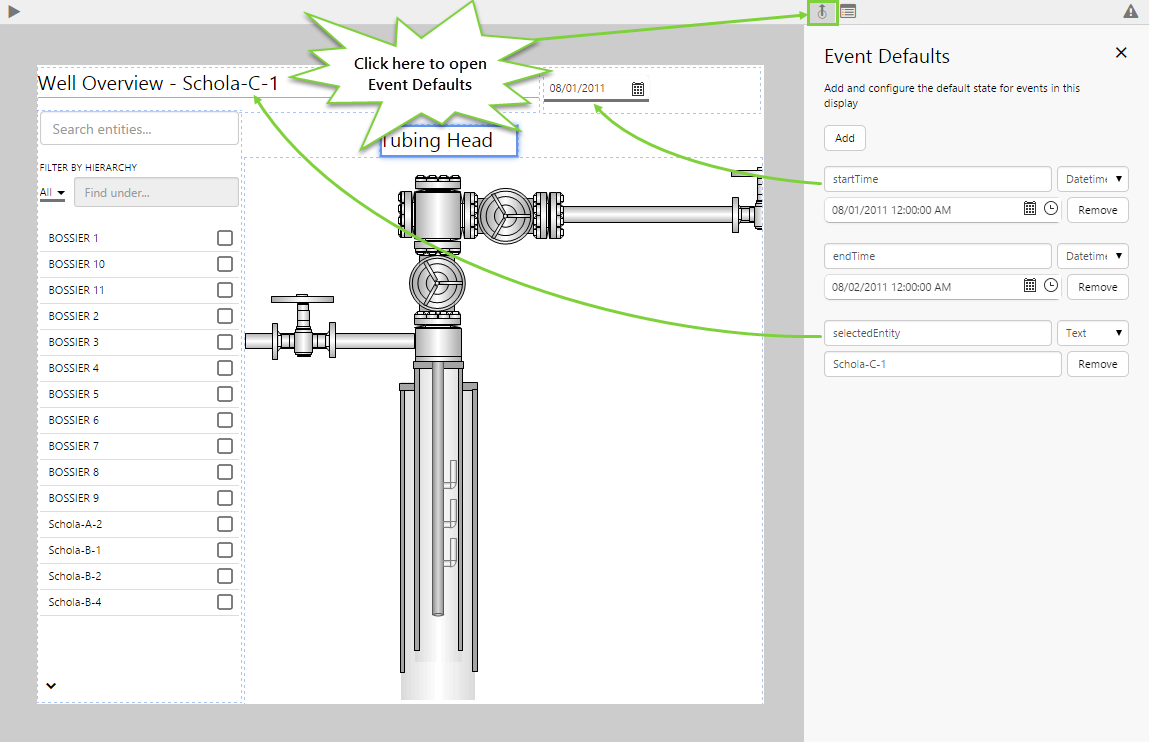
Click the Event Defaults button in the top right of the toolbar, and add the following events:
- startTime (of type Datetime) – select a start date that you know will contain data e.g. 08/01/2011 12:00:00 AM
- endTime (of type Datetime) – select an end date that you know will contain data e.g. 08/02/2011 12:00:00 AM
- selectedEntity (of type Text) – specify an entity that you know is a well and has data associated with it e.g. Schola-C-1
By doing this, the Entity Selector and Date Picker automatically take in these default values, so we will immediately see some actual data in the next step.
Step 8. Add the Data Label for the tubing head
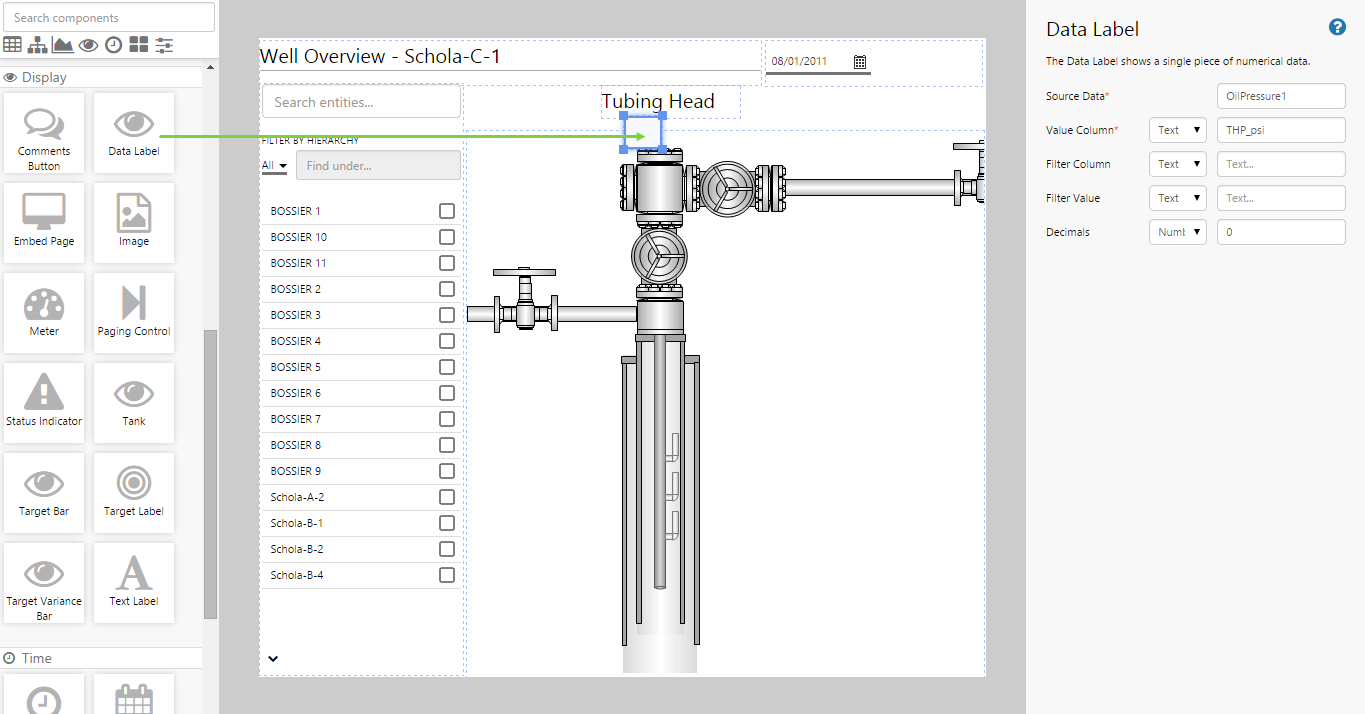
The actual value of the tubing head pressure is displayed by using a Data Label.
- Drag and drop the Data Label component onto the canvas.
- Position it so that it sits above the tubing head in the background image, and below the tubing head Text Label.
- Resize it appropriately.
- In the configuration options, type the following:
- Source Data: OilPressures1
- Value Column: THP_psi
Step 9. Add the label for the measurement units
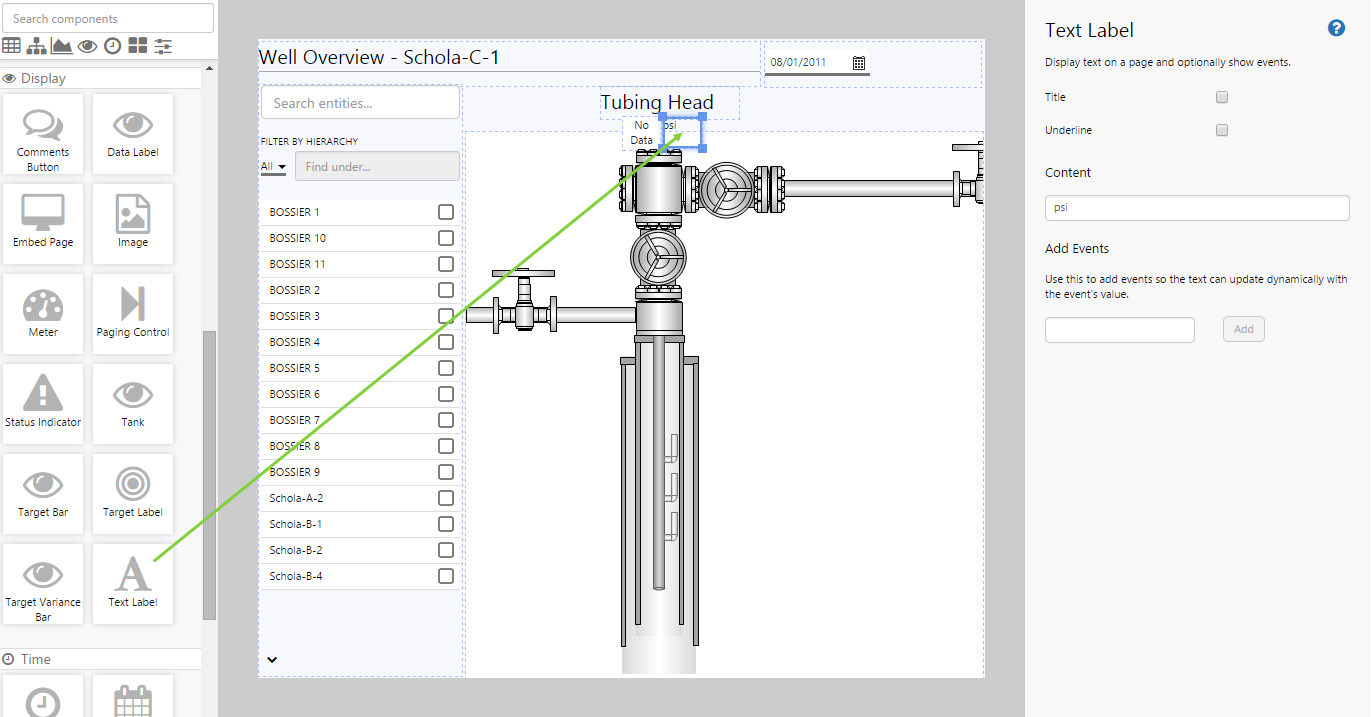
We’ll use another Text Label for the measurement units.
- Drag and drop the Text Label component onto the canvas.
- Position it so that it sits to the right of the Data Label for the tubing head, and resize it appropriately.
- In the configuration options, type the following content: psi.
You may notice that it starts to get a bit tricky to get the alignment just so. Simply persevere and it will work out.
Step 10. All done!
Congratulations! You now have a data label that will update according to the selected date and entity.
- Click the preview
 button on the Studio toolbar to see what your page will look like in run-time.
 - Select different dates and entities and observe the changes in the THP.
![]() Don’t forget to save your page!
Don’t forget to save your page!