Overview
Precision Layout is typically used for pages that contain schematic diagrams, or for other designs where using a Grid Layout is too restrictive or complicated.
This layout lets you put components anywhere on a page and make them any size. It offers more flexibility for single components than a Grid Layout, however because it has a fixed size it doesn’t scale between small and large resolutions.
A Precision Layout can also be inserted into a Grid Layout, and vice versa. You can use this feature to manipulate the resolution of the page so that it is fixed in one part and flexible in another.
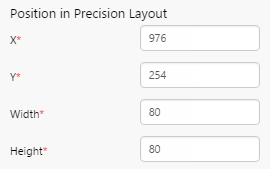
After you have added a component to the Precision Layout, you can reposition it without having to go into the precision layout editor. Component editors have a "Position in Precision Layout" section after the configuration options, which allows you to specify the X and Y coordinates for the component, and also the exact width and height. The coordinates apply to the top left corner of the component.
Another useful way of positioning a component is to use the arrow keys to move it up, down, left, and right.
Tutorial: Creating a Schematic Using Precision Layout
If you're unfamiliar with the process of building pages, read the article Building an Explorer Page.
Precision Layout has no specific parameters. You can begin using this layout by simply dragging the component and dropping it onto the canvas.
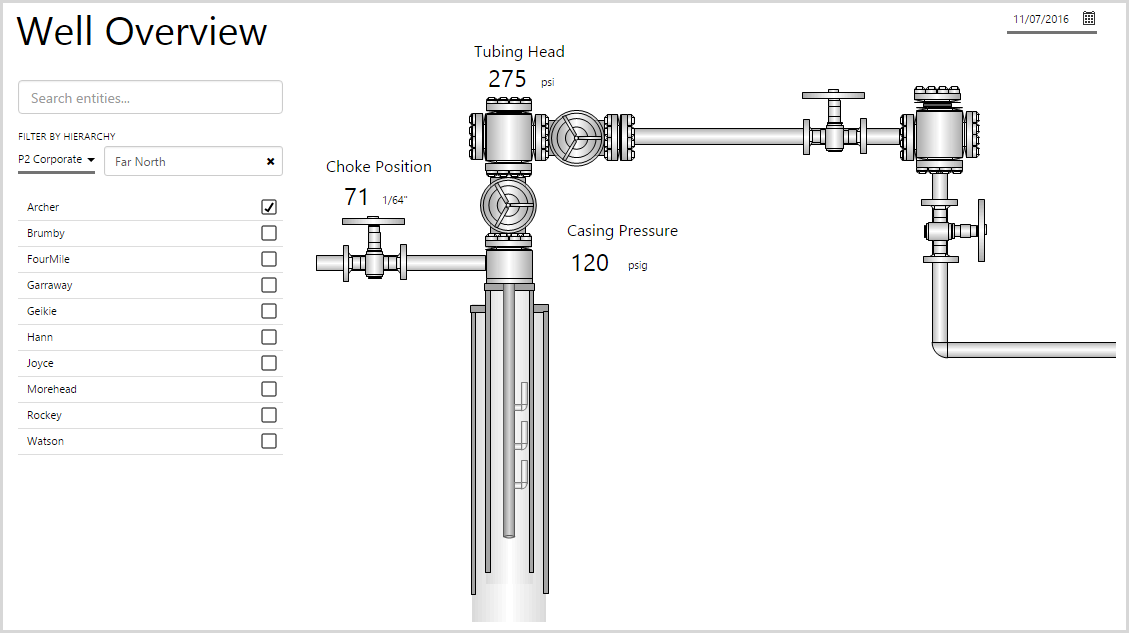
In this topic, we'll show you how to use the Precision Layout to design a simple schematic.
Let’s go through this process, step-by-step.
Step 1. Prepare a Studio Page
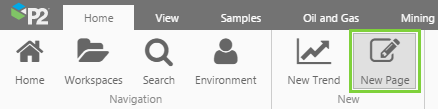
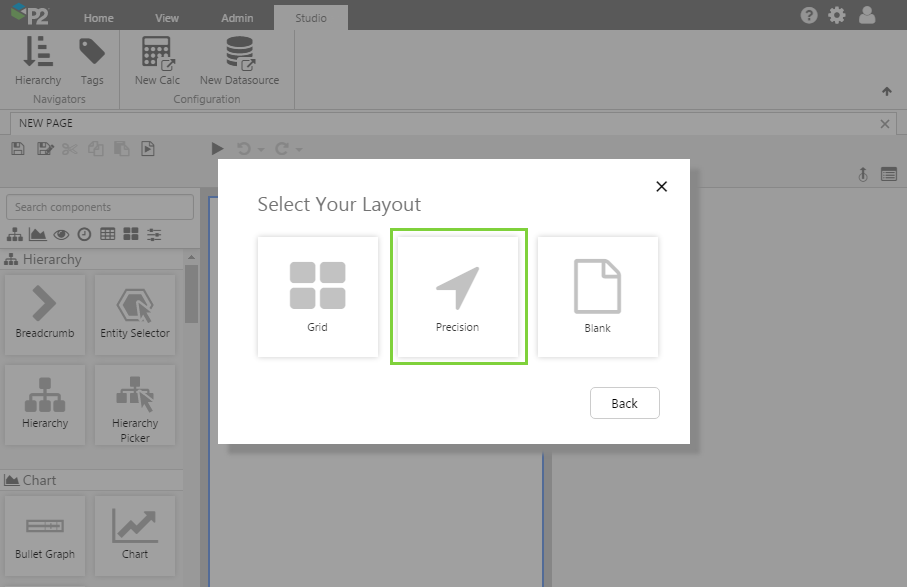
Before you start, click the New Page button on the Home tab of the ribbon. Choose the Precision layout.
Step 2. Add the Text Label for the title
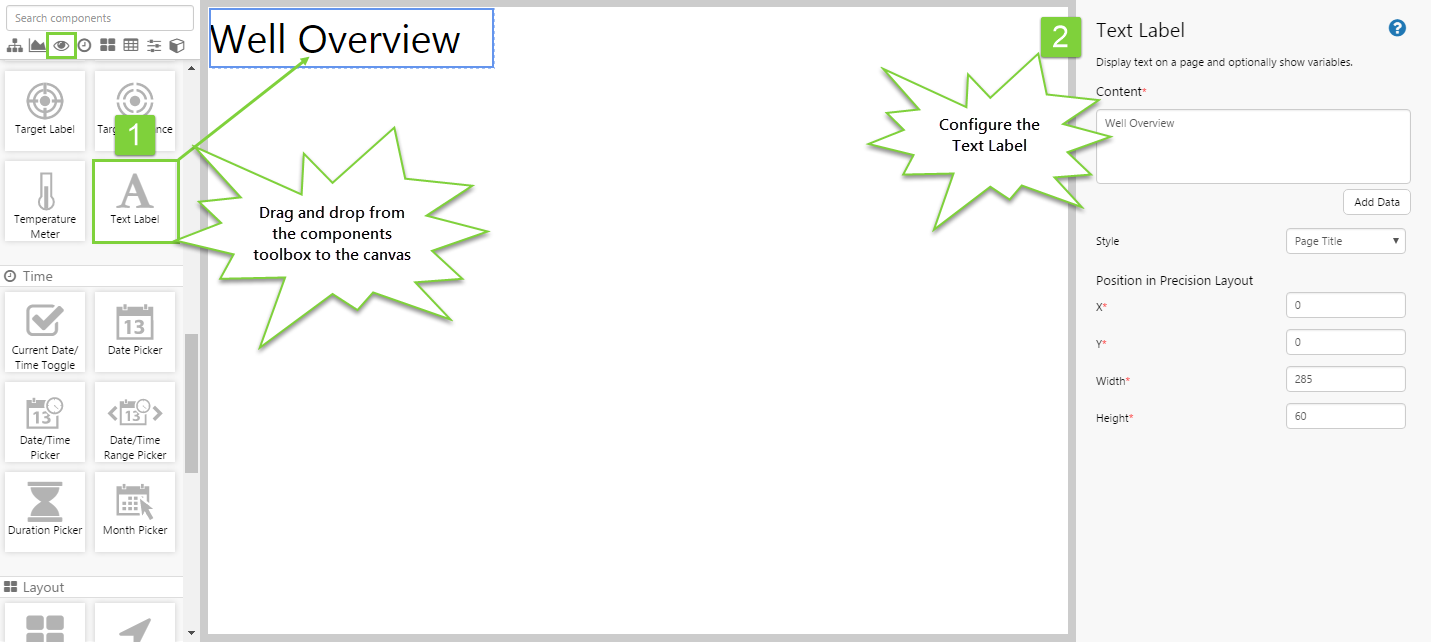
This step adds the title to the page, and is located in the top left corner.
- Drag and drop the Text Label component onto the canvas. The Text Label is in the Display
 group.
 - You will notice that by default it has a square shape, and 4 drag handles will appear in the corners.
- Move the label to the upper left corner, and resize it to the size that you think the text will need.
- In the configuration options, complete the following:
- Content: Well Overview
- Style: Page Title
- Refine the position and size using the Position in Precision Layout options, as follows:
- X: 0
- Y: 0
- Width: 285
- Height: 60
The X and Y options refer to the X-Y coordinates of the top left drag handle of the component.
The Width and Height of the component are specified in pixels.
Step 3. Add the Entity Selector
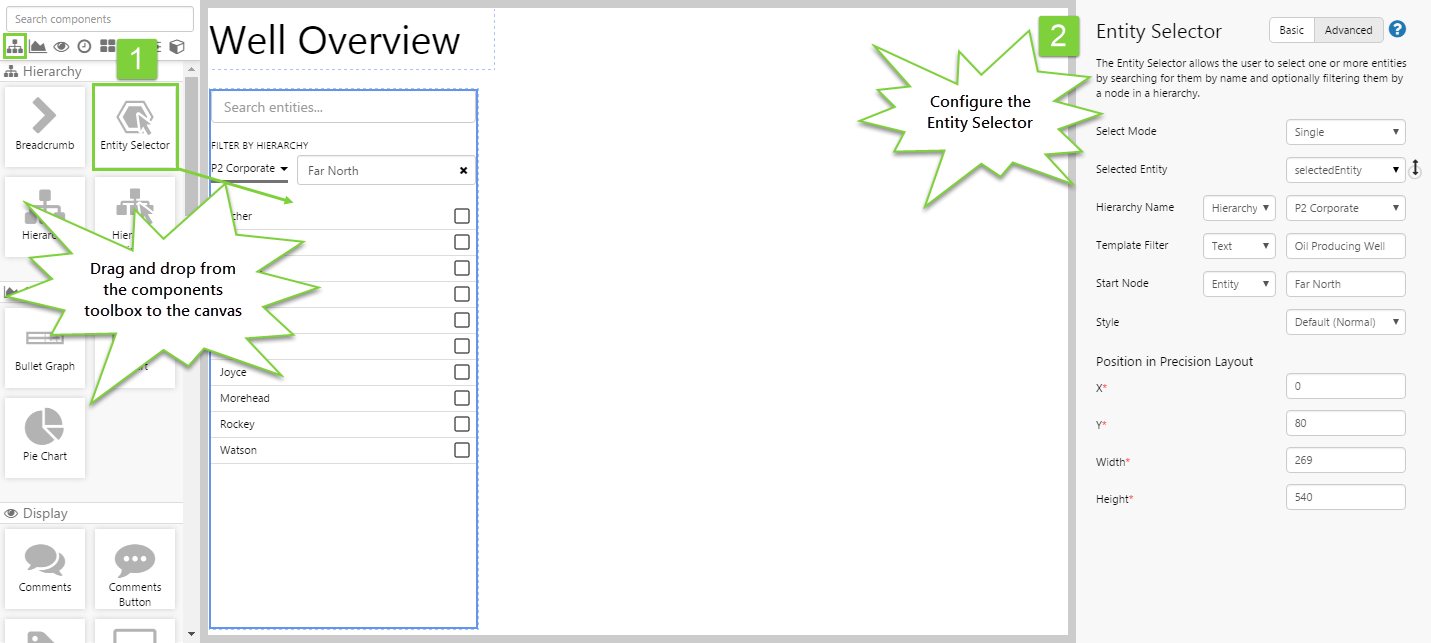
This step allows the user to select an entity, which will drive the data displayed on the schematic.
- Drag and drop the Entity Selector onto the canvas. The Entity Selector is in the Hierarchy
 group.
 - Move it to the left side and resize it so that it's the approximate size you want.
- Click the Advanced button and configure it as follows:
- Select Mode: Single
- Selected Entity: selectedEntity
- Hierarchy Name: (Hierarchy) P2 Corporate
- Template Filter: (Text) Oil Producing Well
- Start Node: (Entity) Far North
- Refine the position and size using the Position in Precision Layout options, as follows:
- X: 0
- Y: 80
- Width: 269
- Height: 540
Step 4. Add the background image
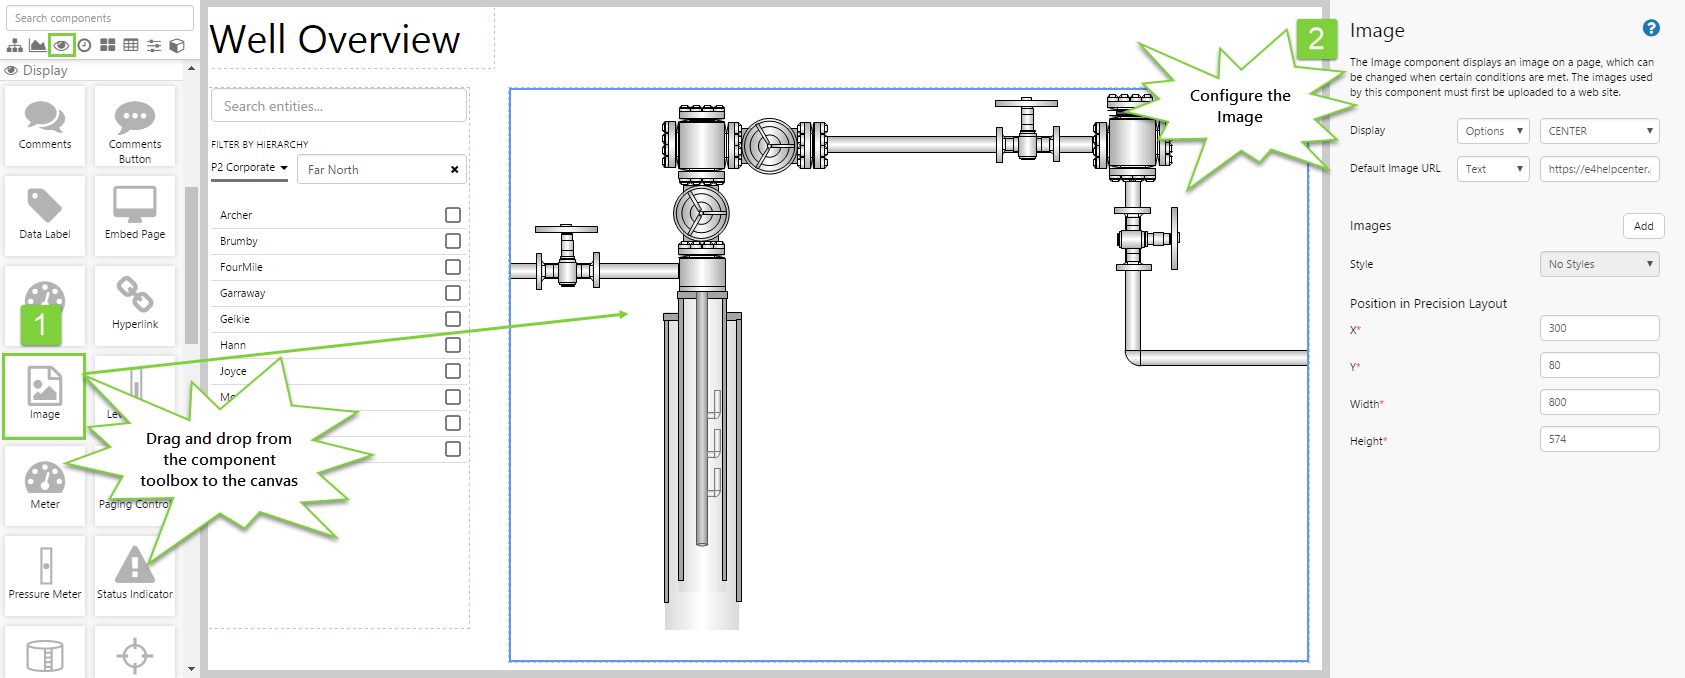
The background image provides the user with the ability to visualise the meaning behind the data. The image must be stored on a secure website (using https) accessible over the network.
- Drag and drop the Image component onto the canvas. The Image is in the Display group.
- Move it to the right of the Entity Selector and resize it approximately.
- Configure the Image options as follows:
- Default Image URL: https://oihelp.corporate.ifs.com/help/Images/GasLift.gif
- Refine the position and size using the Position in Precision Layout options, as follows:
- X: 300
- Y: 80
- Width: 800
- Height: 574
Step 5. Add the Date Picker
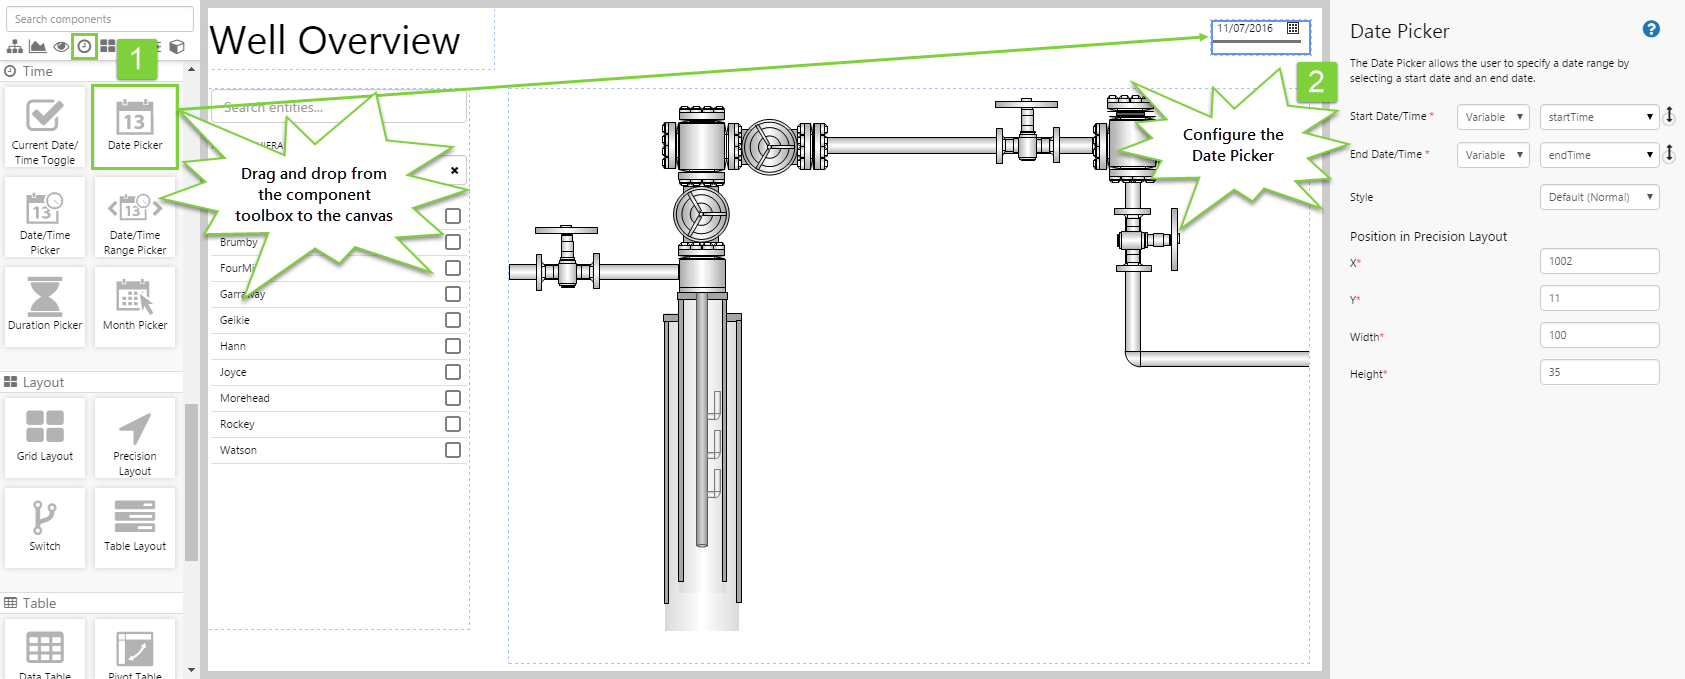
This step adds a date picker to the page, which will drive the data displayed on the schematic.
- Drag and drop the Date Picker component onto the canvas. The Date Picker is in the Time
 group.
 - Move it to the upper right corner and resize it. You don't need to change the configuration options - in the next step we will add defaults for these variables.
- Refine the position and size using the Position in Precision Layout options, as follows:
- X: 1002
- Y: 11
- Width: 100
- Height: 35
Step 6. Set the Default Values
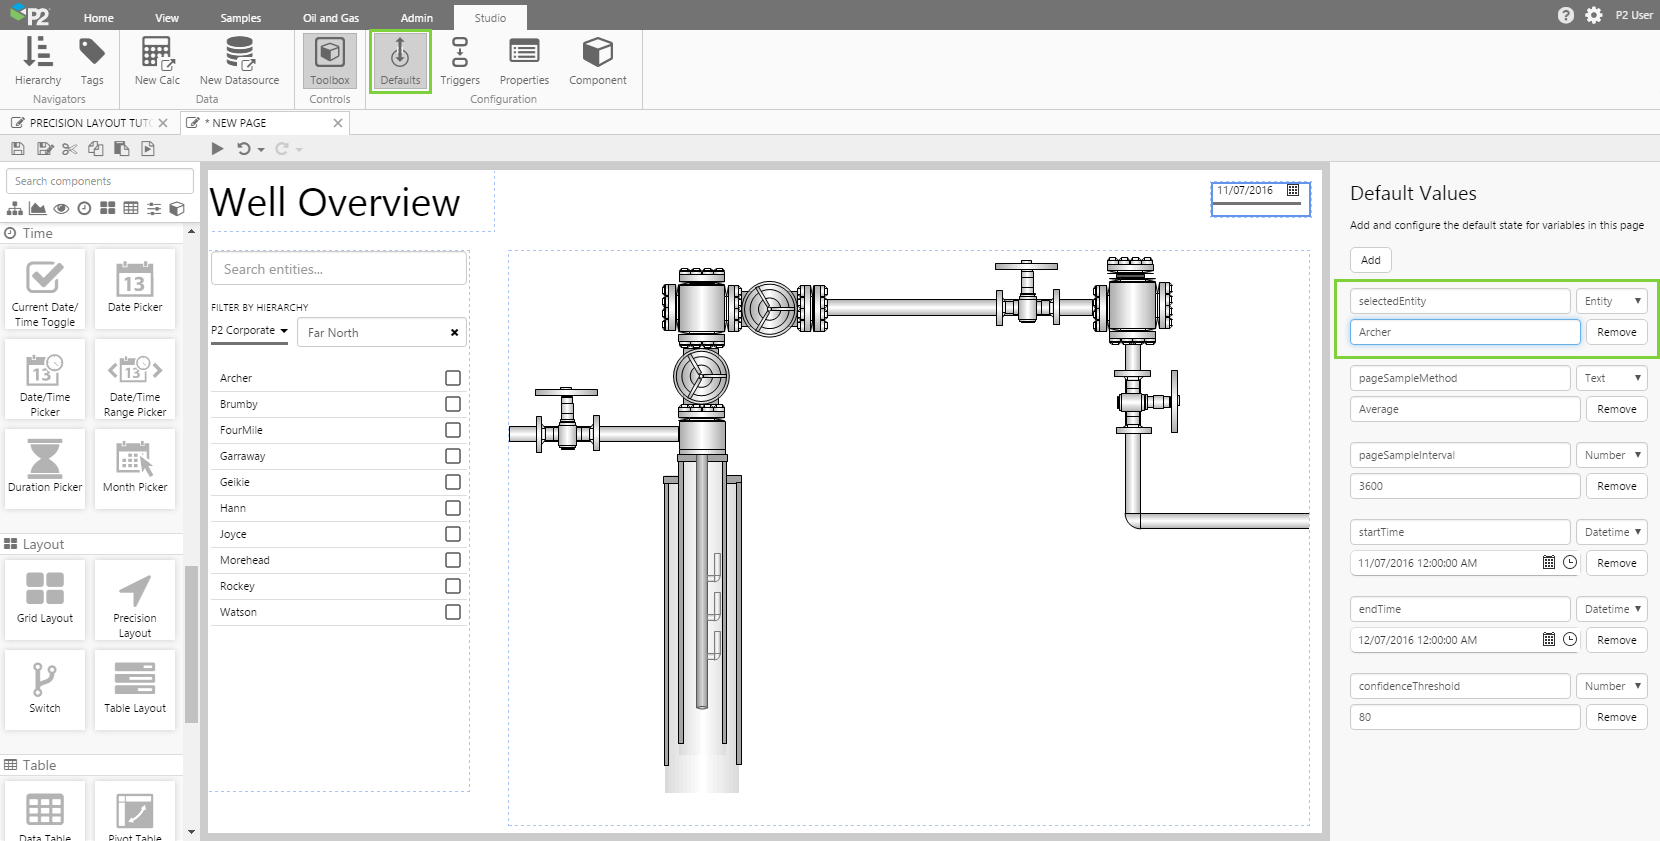
If we don't set any default values, there will be no data displayed on the page when it is first loaded. Using Default Values, we can specify the entity that will always be selected by default when the page is loaded.
You should specify the default values for the selected entity so you can see data in the page when it first loads.
Let’s change the default data that is displayed. We are interested in the variable, selectedEntity .
- Click the Default Values button on the Studio toolbar.
- selectedEntity is listed first, update it to specify "Archer".
You should now see the Entity Selector change so that the check box is selected for the default entity, Archer.
In the remaining steps, we will add text and data at various places on the image.
Step 7. Add the Text Label for the tubing head
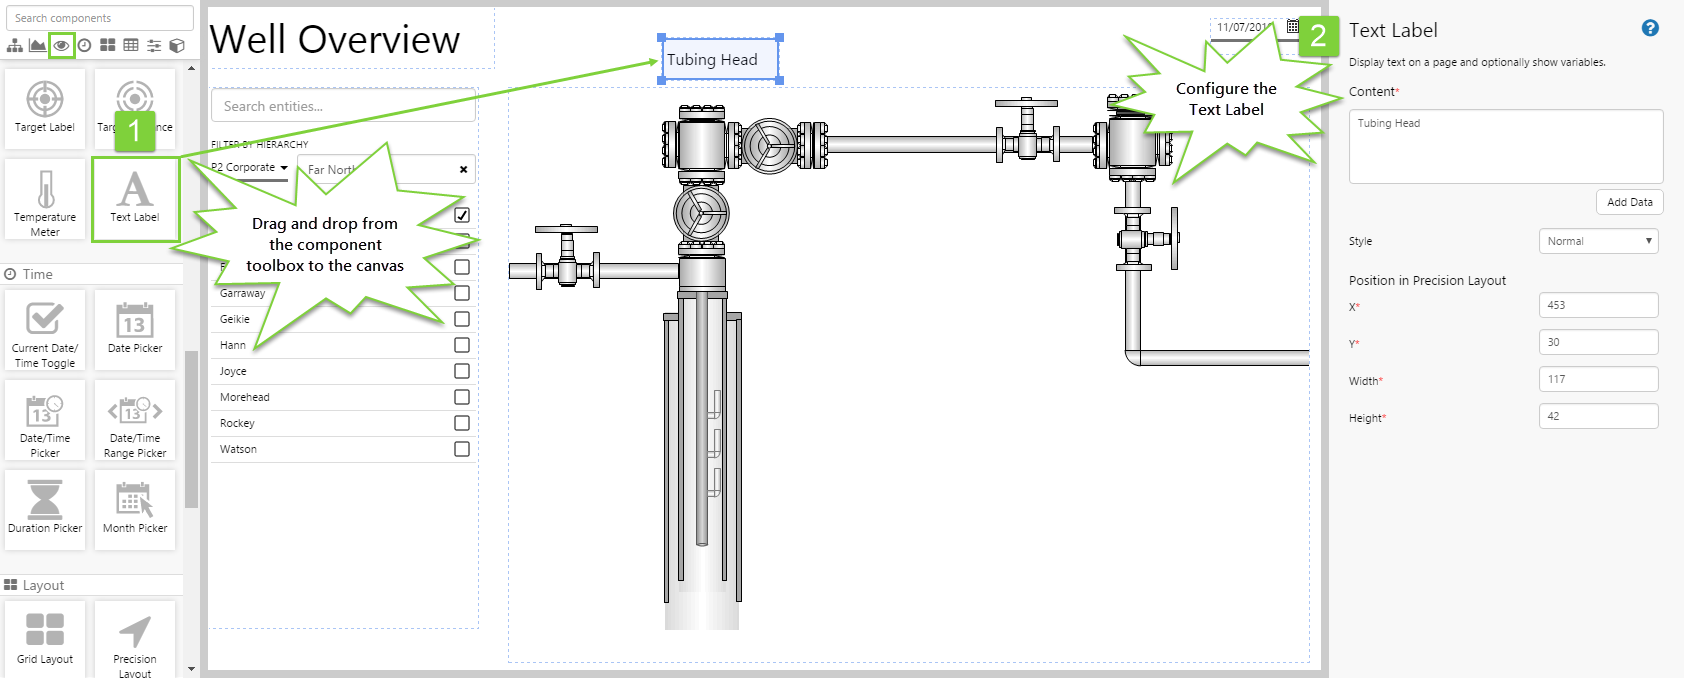
Now we'll start adding the components that will make our schematic show us relevant data. But a data point on its own is confusing if it's not labelled, so let's add a label first. We're going to start with the tubing head pressure.
- Drag and drop the Text Label component onto the canvas.
- Position it so that it sits above the tubing head in the background image, and resize it appropriately.
- In the configuration options, complete the following:
- Content: Tubing Head
- Refine the position and size using the Position in Precision Layout options, as follows:
- X: 453
- Y: 30
- Width: 117
- Height: 42
Step 8. Add the Data Label for the tubing head pressure data item
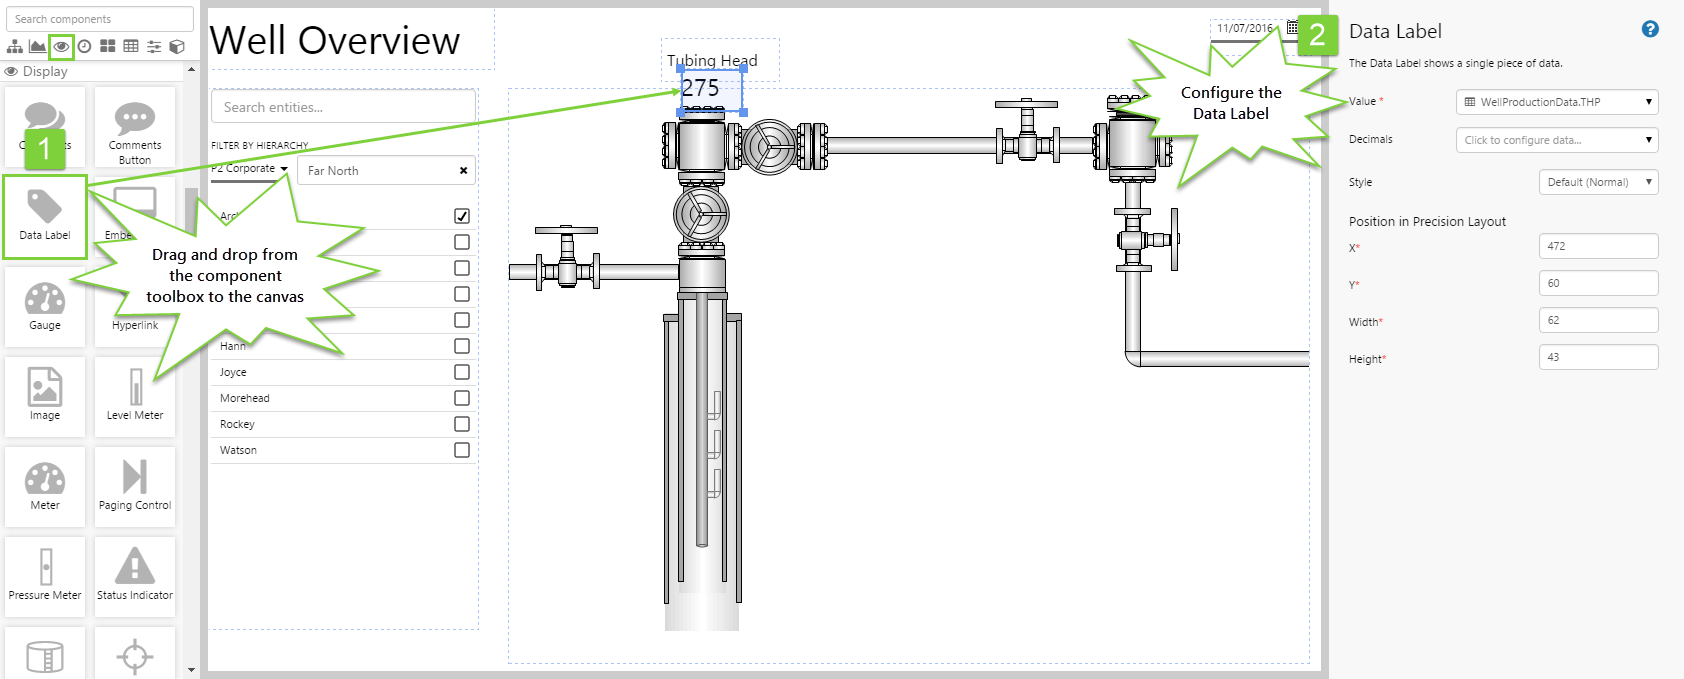
The actual value of the tubing head pressure is displayed by a Data Label.
- Drag and drop the Data Label component onto the canvas. The Data Label is in the Display group.
- Position it so that it sits above the tubing head in the background image, and below the tubing head Text Label.
- Resize it approximately.
- In the Data Label editor, open the Value Data Selector by clicking on the field. You will notice that the Value
 tab is automatically selected. However, for this tutorial, we want to get data from the Well Production Data dataset query, so click the Dataset
  tab. Fill in the fields as follows:
- Dataset Query: WellProductionData
- Filter Column: Entity
- Filter Value: (Variable) selectedEntity
Note: You will need to type this in, it will not be available for selection. - Value Column: THP
Note: See Filter Column and Filter Value for more information on how these fields work.
- EndDate: (Variable) endTime
- EntitiesList: (Variable) selectedEntity
Note: You will need to type this in, it will not be available for selection. - StartDate: (Variable) startTime
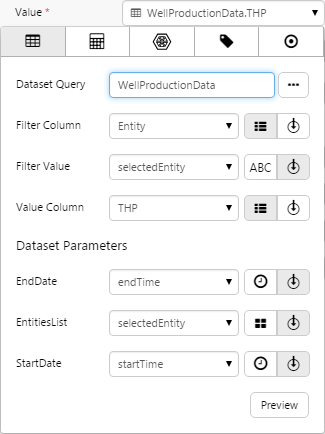
Click the Preview button to check that you are getting data. If the preview window is blank, you may have filled in a parameter incorrectly.
Finally, refine the position and size of the Data Label using the Position in Precision Layout options, as follows:
- X: 472
- Y: 60
- Width: 62
- Height: 43
Step 9. Add the label for the measurement units
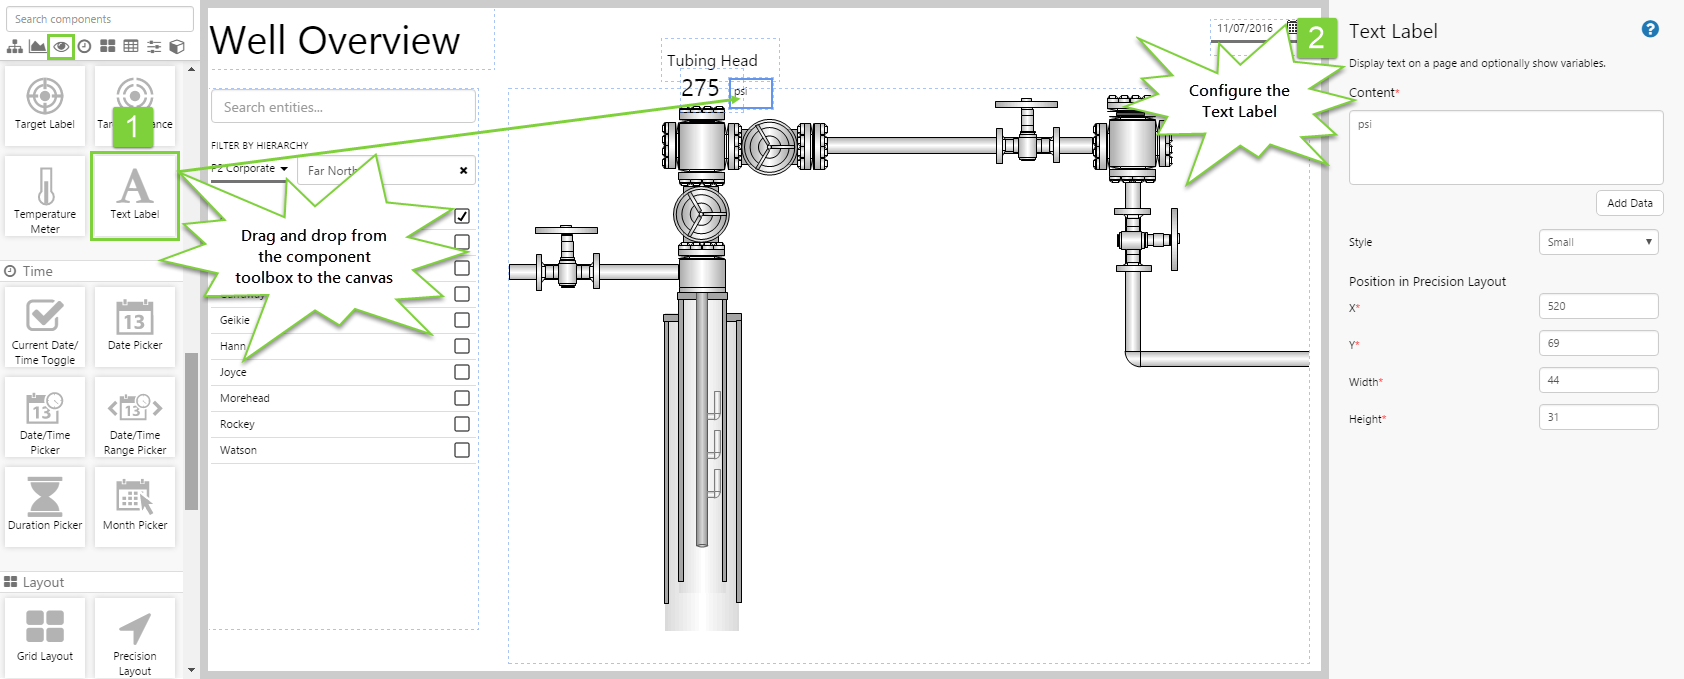
We'll use another Text Label for the measurement units.
- Drag and drop the Text Label component onto the canvas.
- Position it so that it sits to the right of the Data Label for the tubing head, and resize it appropriately. You may notice that it starts to get a bit tricky to get the alignment just so. You can use the arrow keys to move the label up, down, left, or right.
- In the configuration options, complete the following:
- Content: psi
- Style: Small
- Refine the position and size using the Position in Precision Layout options, as follows:
- X: 520
- Y: 69
- Width: 44
- Height: 31
Step 10. Add the labels for the remaining data
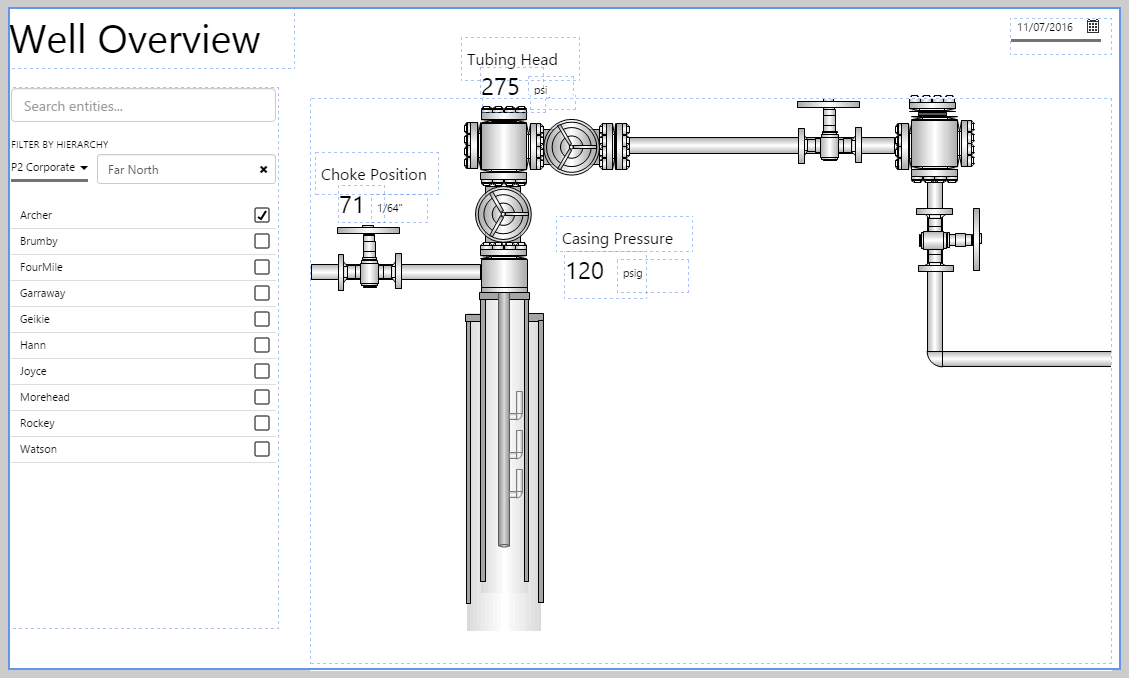
We have a few other values we'd like to display on this schematic, so let's go ahead and do that one by one. Refer to the above image and follow steps 7-9 to add the following:
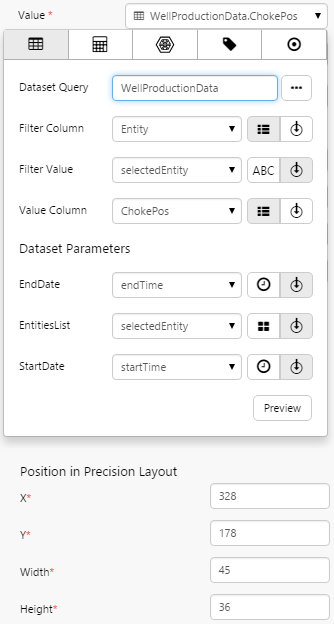
- Choke Position
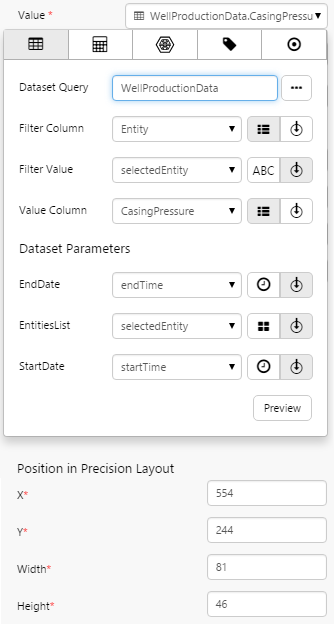
- Casing Pressure
Configure the data labels using the WellProductionData dataset, as follows:
Step 11. All done!
Congratulations! You now have a schematic page with data that will update according to the selected date and entity.
- Click the preview
 button on the Studio toolbar to see what your page will look like in run-time.
 - Choose different dates and entities and observe the changes in the data.
![]() Don't forget to save your page!
Don't forget to save your page!
Release History
- Precision Layout 4.4.0
- Precision Layout 4.3.2