ON THIS PAGE:
Overview
The Embedded Trend component is used to embed a smaller version of a trend within an Explorer page, and is used for quick and simple diagnostics in Display Mode. As with the full Explorer trend, you can use hairlines on the embedded trend, and add comments to tags at a point in time, by clicking the trace line.
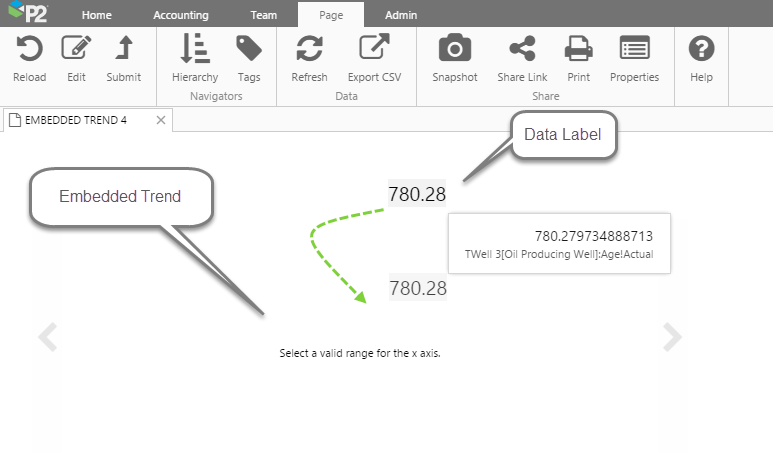
In Display Mode, you can drag and drop time series data labels from the page onto the trend, or drag tags and attributes from the Navigators. Right-click on the embedded trend to open a full Trend display.
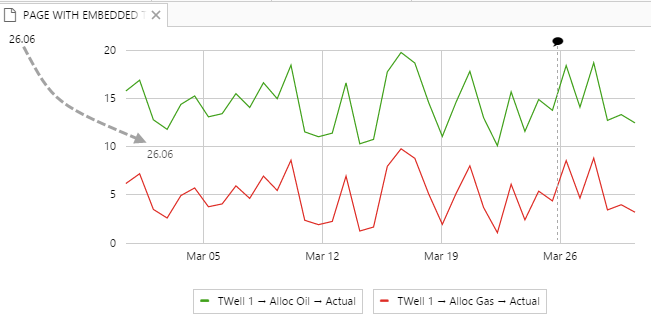
Dragging a data label onto an embedded trend
Tutorial
In this tutorial, we'll show you how to add an embedded trend to a page in Studio, and then how to use the trend in Display Mode.
Adding the Embedded Trend
Step 1. Prepare a Studio Page
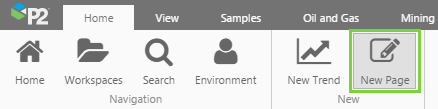
Before you start, click the New Page button on the Home tab of the ribbon. Choose the Precision Layout.
Step 2. Add an Embedded Trend
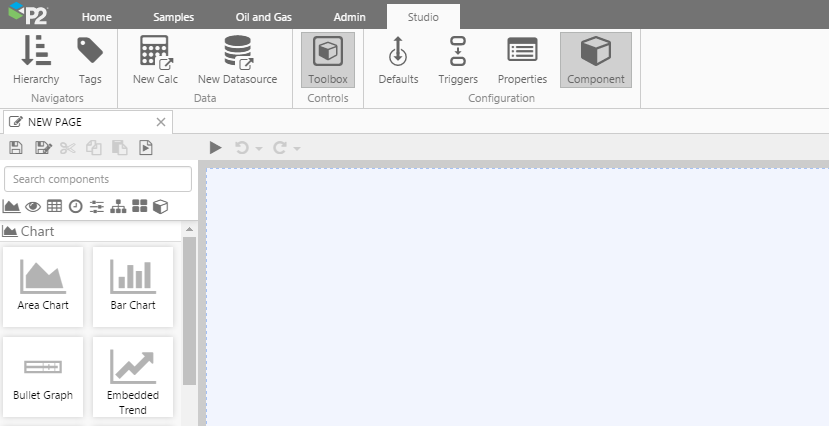
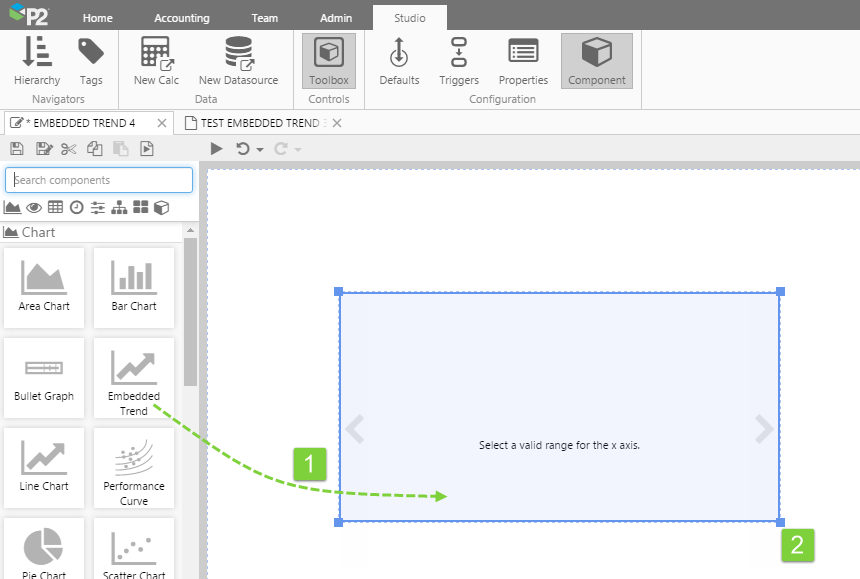
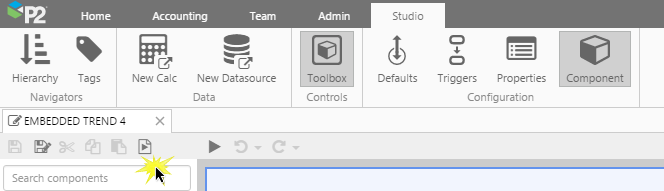
The Embedded Trend component is found under Charts in the Toolbox. Drag and drop it onto a page, and resize it so that it can be used to add data in Display Mode.
1. Drag and drop it onto a page in Studio (Design Mode).
2. Resize the embedded trend so that it can be used to add data in display mode.
It’s ready to use, or can be further configured.
Using the Embedded Trend
Save the page by clicking Finish and Open ![]() so that you can see it in Display Mode.
so that you can see it in Display Mode.
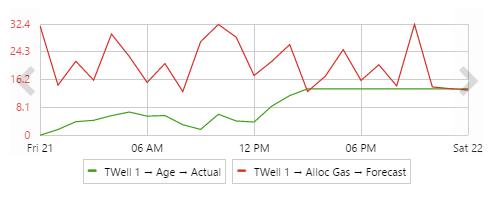
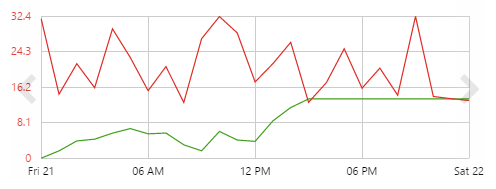
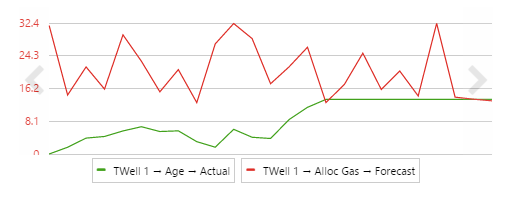
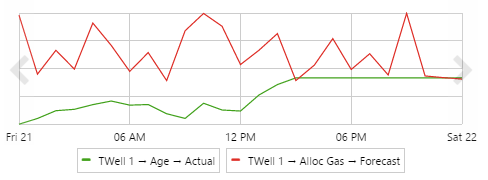
This is how your blank embedded trend appears in Display Mode.
![]()
Dragging Values onto the Embedded Trend from the Navigators
Still in Display Mode, see how you can drag and drop values from the Hierarchy Navigator and Tags Navigator onto the embedded trend.
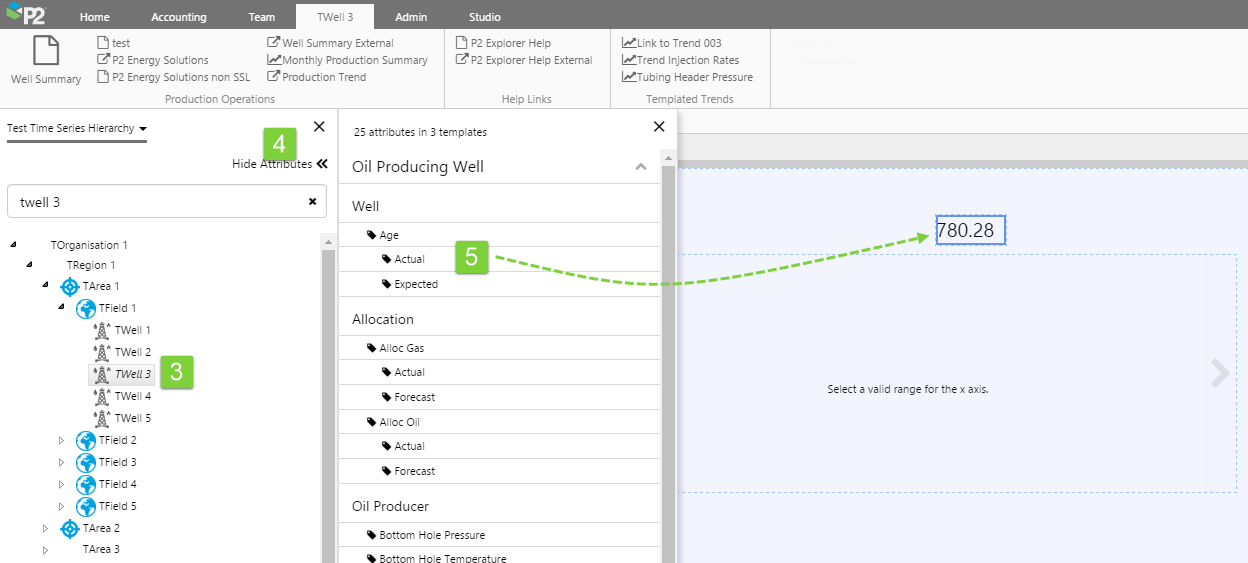
1. On the Page ribbon tab, click Hierarchy to open the Hierarchy Navigator.
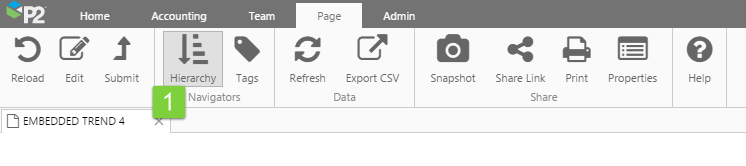
2. Select an entity.
3. Open the Attributes Panel, by clicking Show Attributes (the label changes to Hide Attributes).
4. Drag and drop an attribute value onto the embedded trend.
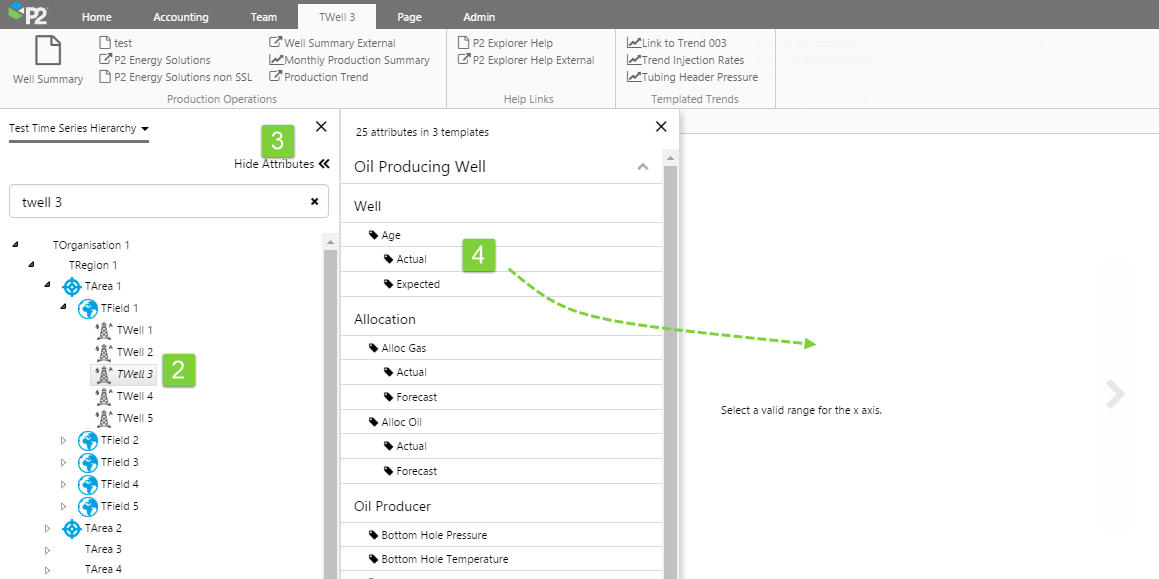
5. Click Hide Attributes to hide the Attributes Panel.
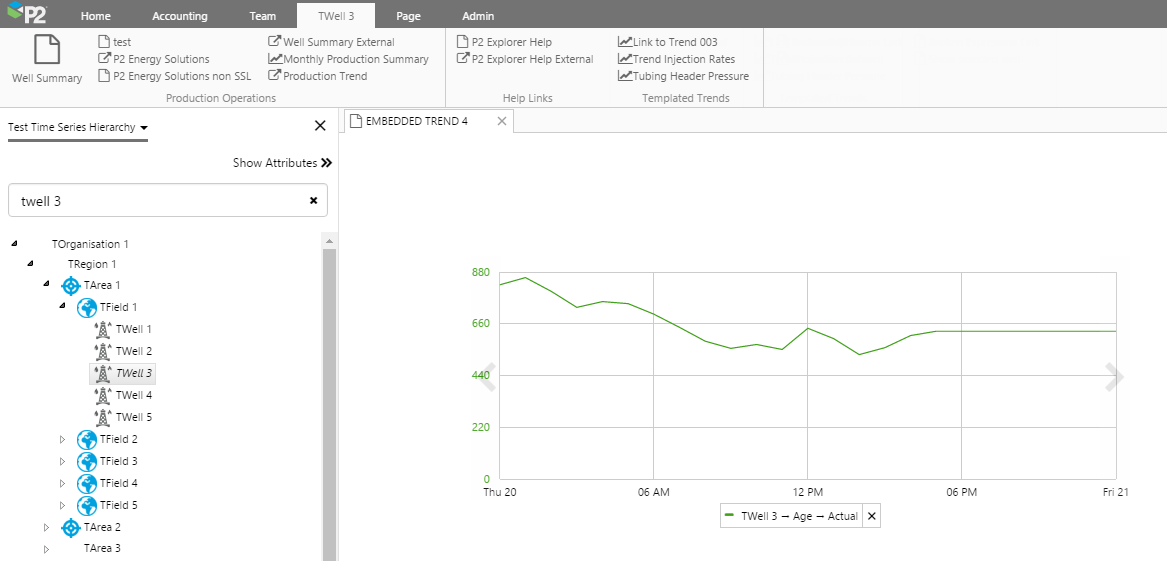
The attribute value appears on the embedded trend.
You can also add a tag: open the Tags Navigator, then drag and drop a tag onto the embedded trend.
Watch this short video to follow the steps outlined above.
Dragging Values onto the Embedded Trend from Data Labels on the Page
Also in Display Mode, you can add a data label's value onto the embedded trend, provided the value is a tag or an attribute.
First, we'll add data labels to the page. Then we'll add these to the embedded trend in Display Mode.
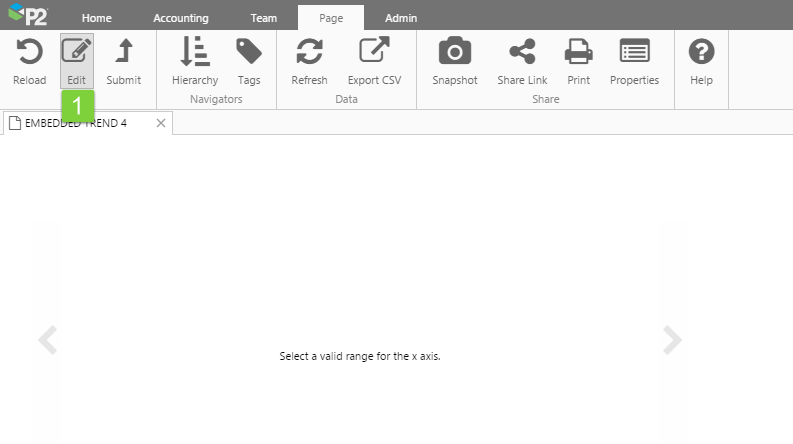
1. On the Page ribbon tab, click Edit to get back into Studio (Design) Mode.
2. On the Studio ribbon tab, click Hierarchy to open the Hierarchy Navigator.
3. Select an entity.
4. Open the Attributes Panel by clicking Show Attributes (the label changes to Hide Attributes).
5. Drag and drop an attribute value onto the page (which is still in Studio Mode), just above the embedded trend.
Now try this out in Display Mode.
1. Switch to Display Mode by clicking Finish and Open ![]() .
.
2. In Display Mode, drag and drop the data label onto the embedded trend.
The value is added as a trace line.
Watch this short video to follow the steps outlined above.
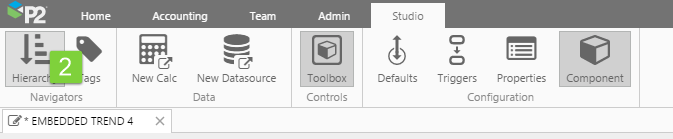
Configuring an Embedded Trend
The embedded trend works without any configuration, as many of the options are selected by default. Its purpose is to provide a place for users to add or remove data in Display Mode.
If you would like to configure the embedded trend, here are the options:
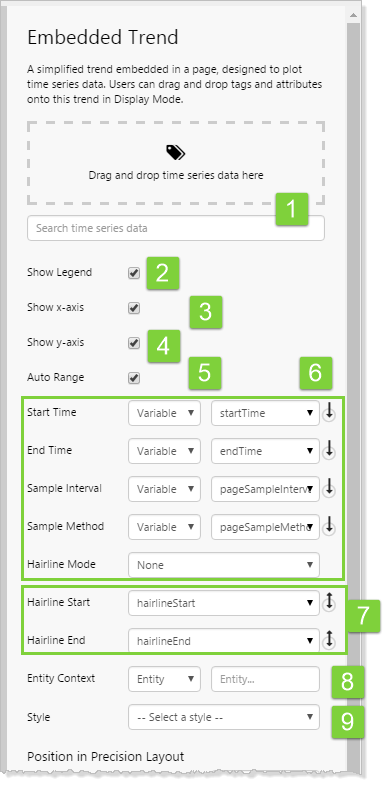 |
1. Data:
2. Show Legend:
3. Show x-axis:
4. Show y-axis:
5. Auto Range:
6. Trend Controls: - Start Time defines the start of the trend range. The default value here is the page default for startTime.
7. Hairline Start and Hairline End:
8. Entity Context:
9. Style: |
Configuring Data for the Embedded Trend
Either drag and drop attribute values or tags from the Navigators, or type the values into the Search edit box.
This video shows how to add an attribute value, a tag, and an ad hoc calculation to the embedded trend, by typing into the Search edit box.
Note that in Display Mode, you can remove data that was added in Display Mode [2], but data added in Design Mode [1] cannot be removed.
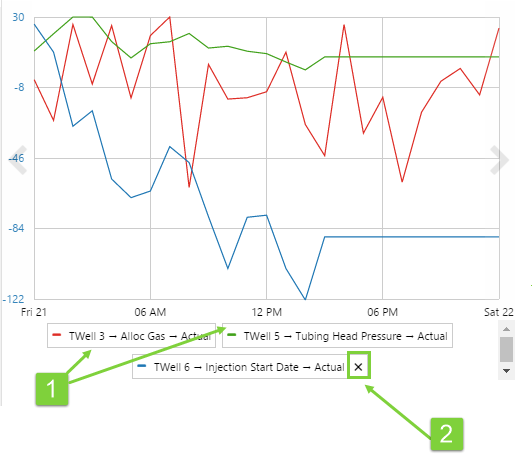
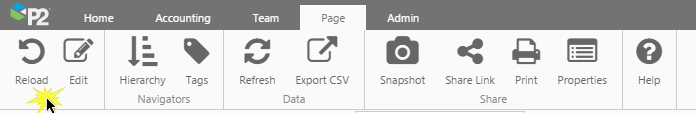
To remove a single trace item, click the little X in the legend. To remove all data added in Display Mode, click Reload on the Page ribbon tab.
Configuring Legend and Axes
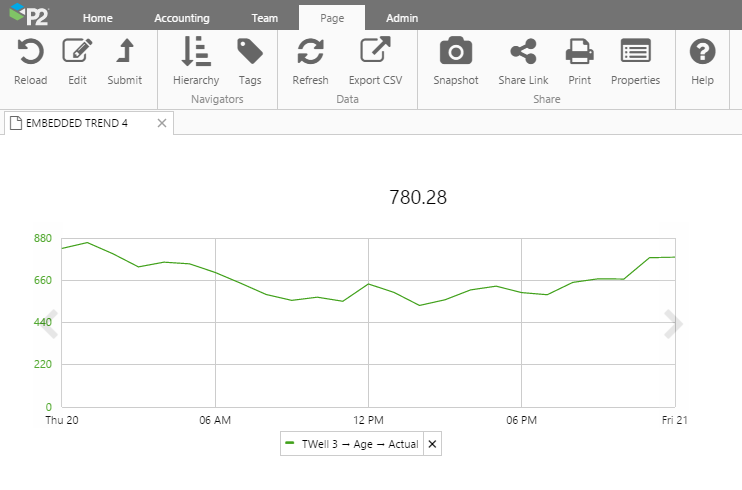
Here are some examples of how the embedded trend appears in Display Mode, depending on how the options are configured.
| No change to the configuration of legend, axes or auto range |
 |
| Show Legend is deselected |
 |
| Show x-axis is deselected |
 |
| Show y-axis is deselected |
 |
| Auto Range is deselected |
 |