ON THIS PAGE:
Overview
IFS OI Explorer uses IFS OI Server to deliver data from any number of data sources or calculations, on demand.
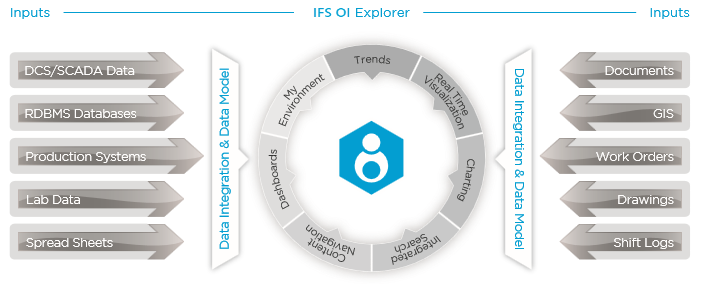
This article describes the different types of data that Explorer can display, and how Explorer displays and interacts with the data.
Data Flow
IFS OI Server fetches data for IFS OI Explorer's pages, trends and hierarchies.
Tabular Data
Typically, tabular data is used to populate charts, data tables and pivot tables, utilising large sets of data.
Explorer requests the data using user-controlled variables or default values on a page, to set query parameters.
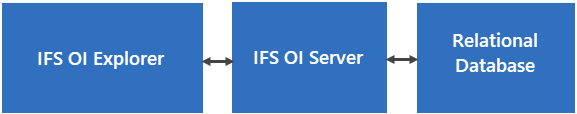
Tabular Data is retrieved from a relational database by Server (using dataset queries that are stored in the Server database), then displayed on Explorer pages.
Time Series Data
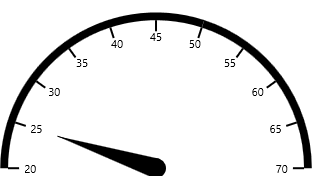
Time series data is used in Explorer Trends, or on graphical display components such as tanks, meters and gauges on Explorer Pages. Data labels can be used to show time series (tag) data on a schematic diagram, showing changing values for different date selections, or for different selected entities.
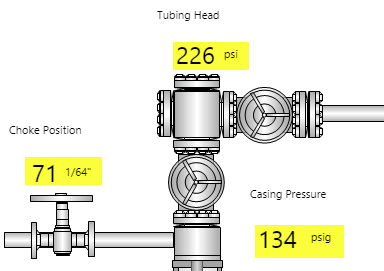
A schematic diagram, with time series data showing in the data labels (highlighted)
Typically, Explorer requests the data when a user navigates through a page hierarchy, selecting various entities, or when a user changes periods using one of the various time picker controls.
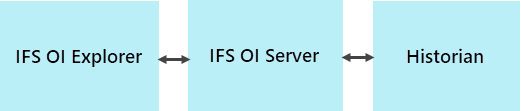
Time series data is retrieved from an historian, using a Server Adaptor specially suited for the type of historian, or from a relational database, using Server's Relational Adaptor, and then displayed on Explorer pages.
Attribute Values
Tags can be assigned to an entity's attribute values, so that this becomes time series data. (Other options for an attribute value are fixed values, which can be of type: Boolean, Date Time, Decimal, Duration, Integer, or String.)
Calculations
Tags can form part of a calculation expression. Calculations that use tags are also time series data.
Digital State Sets
Digital State Sets can be defined in Server and then applied to tags and calculations.
Here are some examples of digital state sets:
| Digital State 1 | Digital State 2 | Digital State 3 | |||||
| Name | Value | Name | Value | Name | Value | ||
| Off | 0 | Off | 0 | Off | 0 | ||
| On | 1 | On | 1 | On | 1 | ||
| Open | 2 | Fail | 2 | ||||
| Closed | 3 | ||||||
Tags or calculations that are assigned a Digital State Set will display the string value (Name) from the Digital State Set in place of the corresponding digital value (Value) from that State Set, when used in any of the following of Explorer’s page components:
- Data Label
- Text Label
- Status Tile
- Data Table
- Table Layout
For example, a data label’s value is a calculation that has the Digital State 3 digital state set assigned. When the calculation returns the value 0, the data label displays ‘Off’. When the calculation returns the value 1, the data label displays ‘On’, and when the calculation returns the value 2, the data label displays the value ‘Fail’. For any other value, the data label displays that value, as there is no matching name in this digital state set.

A data label displaying the name ‘On’, when the data value is 1
Data Presentation
Explorer pages and trends are designed to display data for diagnostics and analysis.
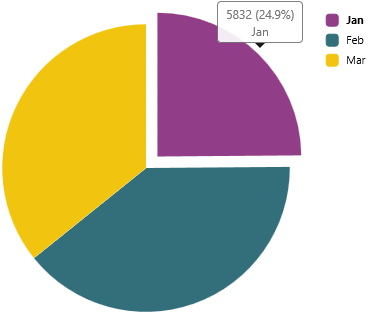
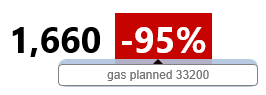
Some of the IFS OI Explorer components used to display or access data:
|
|
Interactive Controls and Data Selections
Explorer also provides interactive controls, allowing the end-user to choose which data to view.
Data Selection Components
Below are just some of the IFS OI Explorer components that are used to interact with data.
|
|

The Explorer page designer chooses what data to use for a component, and selects this data using the Data Selector editor.
Depending on what a component is used for, there can be up to five separate Data Categories for a page designer to choose from, when selecting data.
![]()
|
|
Dataset | Tabular data returned from a dataset datasource. | |
|
|
Ad hoc Calculation | An ad hoc calculation using tags and/or attributes. | |
|
|
Attribute | A piece of data describing a specific characteristic of an entity. | |
|
|
Tag | A piece of data or a calculation. (This can also be referenced by an attribute.) | |
|
|
Value | A fixed or variable numerical value, defined in Studio. |
Hyperlinks and Data Selections
Explorer hyperlinks use Variable Mapping to send data selections to the destination page, trend, or URL.
Explorer Trends and Data Selections
The Explorer trend has several controls, which determine how the trend data is fetched.
Trend Controls with Duration
Trend Controls with Fixed Times
Writing Data
Explorer allows users to update data for tags and attribute values, overwriting their existing value for a single data point.
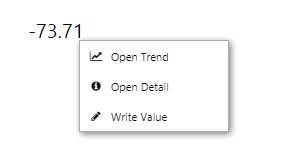
Tag or Attribute Value's right-click menu options
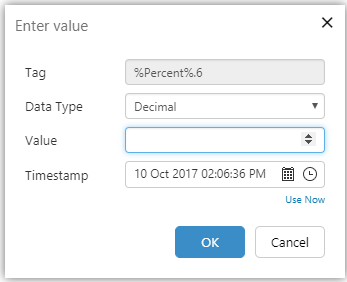
Updating a tag value
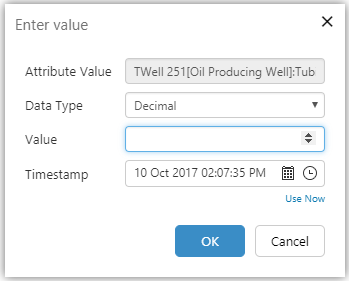
Updating an attribute value
Data Organised in Hierarchies
Hierarchies are used for navigating through entities that have been logically modelled to suit the solution. For example, you could have an Equipment hierarchy, a Geographical hierarchy, and an Accounting hierarchy, each giving a different perspective on data relationships. Server stores the hierarchy structure, which is then displayed in Explorer in the hierarchy panel. You can set up your own hierarchy in Server, or use a hierarchy from a separate data source, using a hierarchy sync; this hierarchy is refreshed during scheduled hierarchy syncs, retrieving the latest data to Server from the relevant data sources.
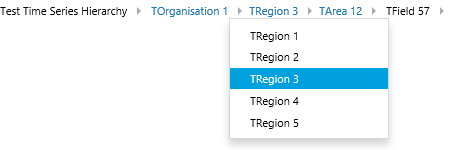
Hierarchies can be used on pages - for example in the breadcrumb or the hierarchy components.
|
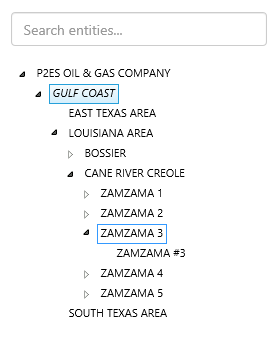 A Hierarchy on a Page |
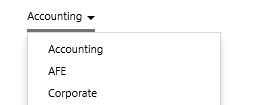
You can also view, search and navigate through hierarchies or search for tags from any Explorer Page or Trend, from the Home, Page and Studio ribbon tabs.
Comments to Describe Data
Comments are used to describe data in IFS OI Explorer. IFS OI Explorer trends and some pages allow you to capture comments and replies, about entities or tags on the page or trend. Comments are stored in IFS OI Server, with context and an audit history, to facilitate searching, filtering and linking.
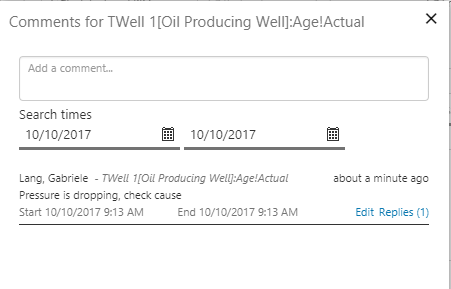
A comment with a single reply