Overview
The Simple Line draws a line in various directions. It is typically used in mimics and schematics to join different elements on a page.
How to configure a line:
- Choose the direction of the line.
- Choose the arrowheads.
- Choose the style.
- Optionally override the thickness and line style that come with the style.
The following diagram shows the component editor of the Simple Line, with the component on its left:

Tutorial: Creating a Basic Mimic
If you're unfamiliar with the process of building pages, read the article Building an Explorer Page.
In this tutorial, we’ll look at creating a basic mining mimic by adding various components connected with Simple Lines. At the end of the tutorial, your page should look like this:
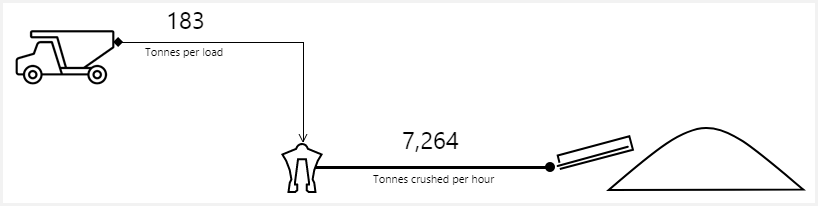
Let’s go through this process, step-by-step.
Step 1. Prepare a Studio Page
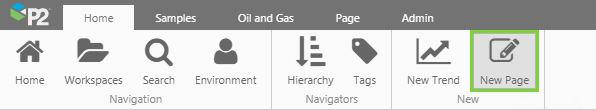
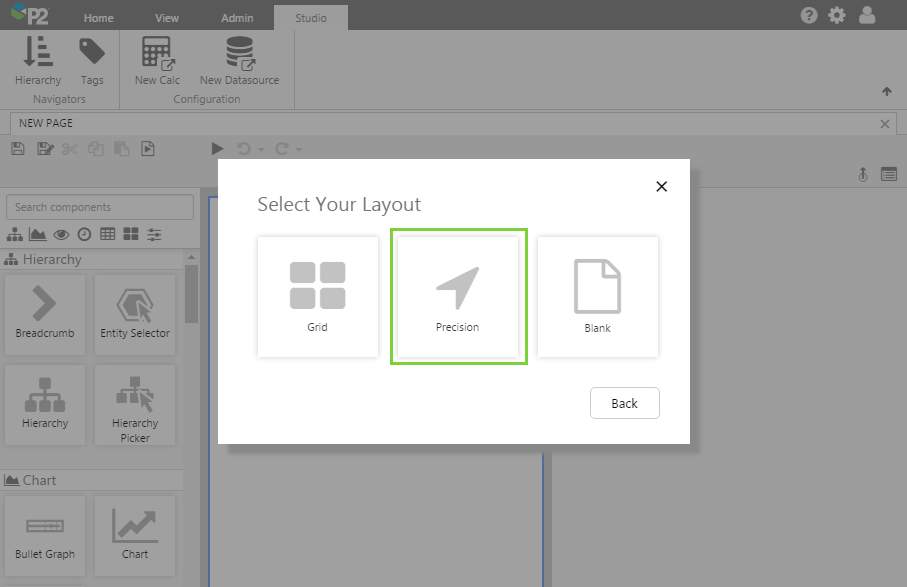
Before you start, click the New Page button on the Home tab of the ribbon. Choose the Precision layout.
Step 2. Add the Images to the Page
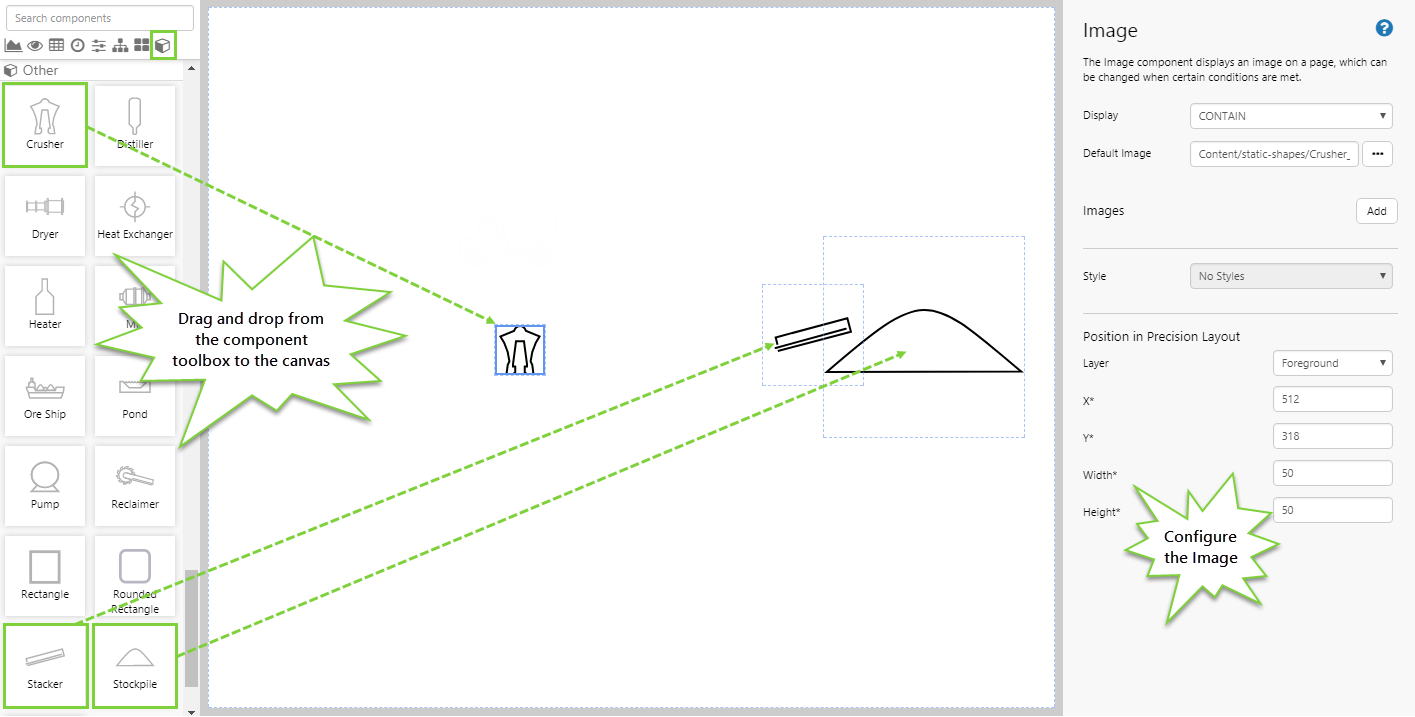
Explorer comes with several pre-configured mining images in the component toolbox, available in the 'Other' ![]() category.
category.
We will start by adding some of these images to the page. Add a Crusher, Stacker, and Stockpile, and configure them as follows:
| Crusher | Stacker | Stockpile | |
| X | 512 | 780 | 841 |
| Y | 318 | 278 | 230 |
There is no pre-configured image for a truck, so we'll add one using the Image component, which is in the 'Display' ![]() category. Drag and drop this onto the page and configure it as follows:
category. Drag and drop this onto the page and configure it as follows:
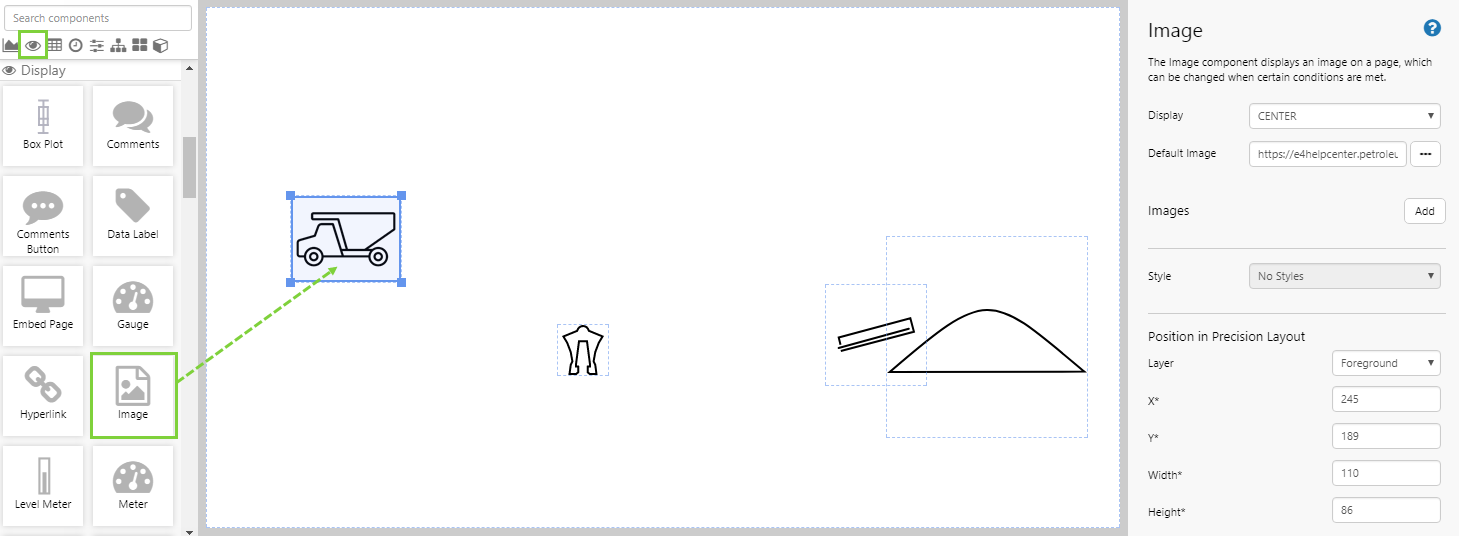
Image:
Default Image URL: https://e4helpcenter.petroleumplace.com/help/Images/Truck_Small.svg
X: 245
Y: 189
Step 3. Add a Simple Line
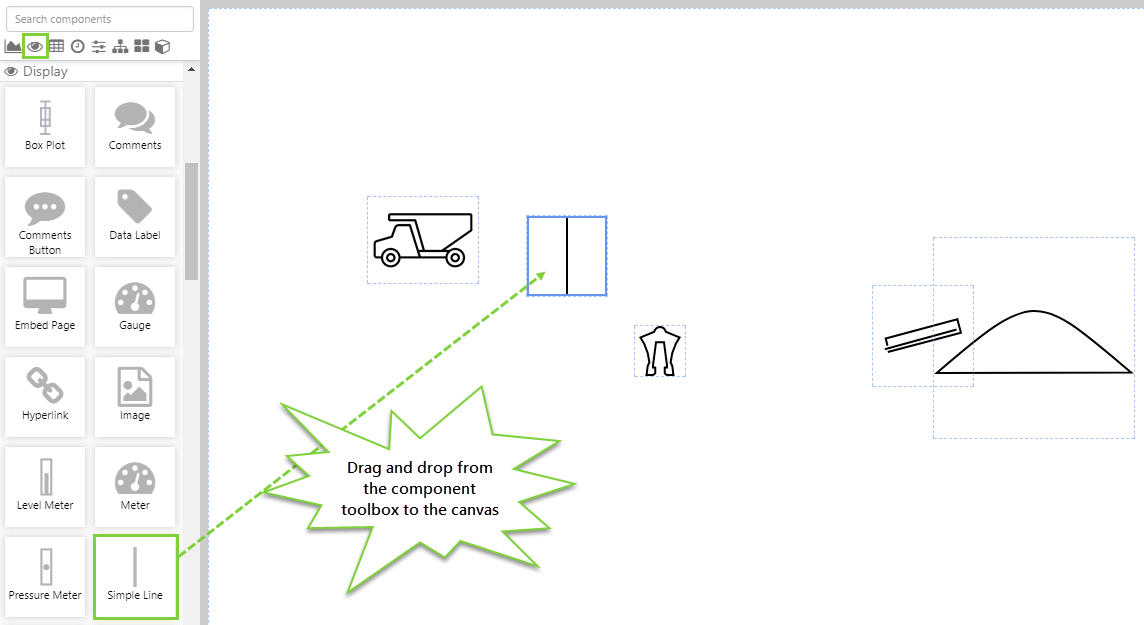
Drag and drop the Simple Line component onto the canvas, positioned approximately as shown in the screenshot above. The Simple Line component is in the Display ![]() group.
group.
Step 4. Configure the Simple Line
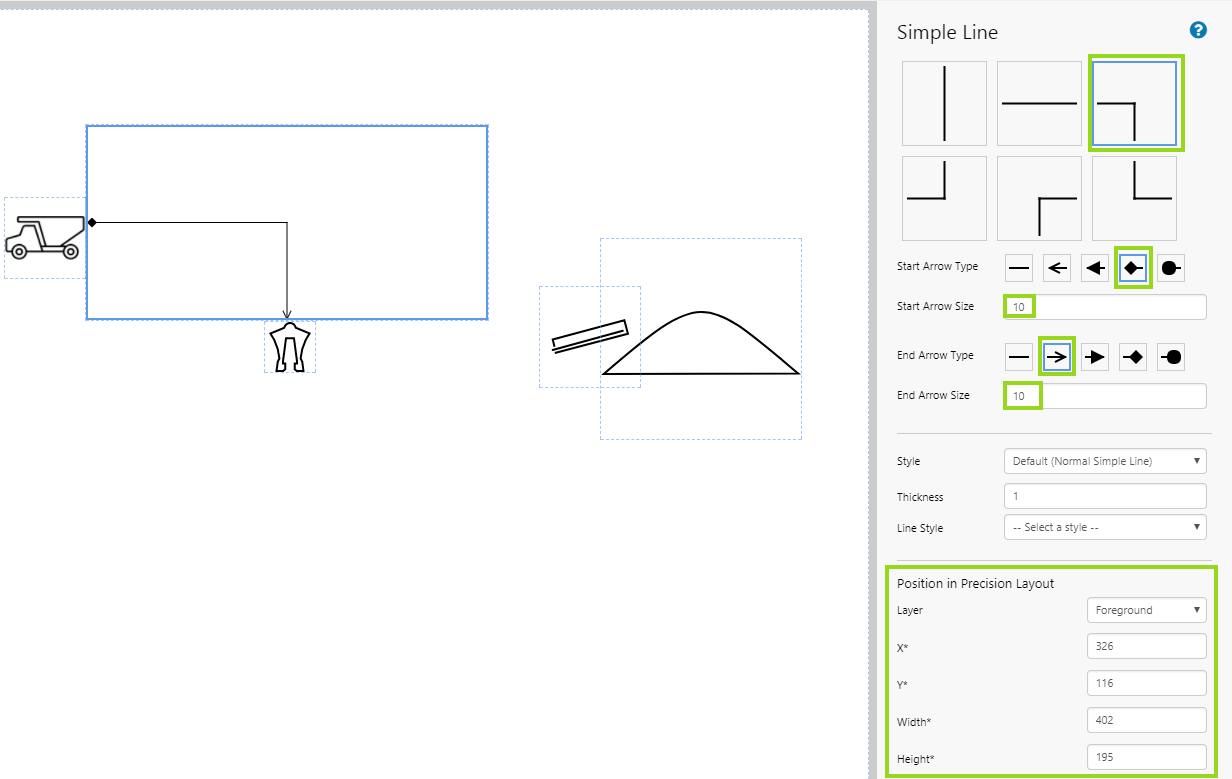
Use the drag handles to manually adjust the size of the line. Note how the line extends to the bounds of the shape. This means that you can also use it in a grid layout to automatically resize with the page.
Configure the line as follows:
| Direction | Left-Bottom Corner |  |
| Start Arrow Type | Diamond | |
| Start Arrow Size | 10 | |
| End Arrow Type | Open Arrow | |
| End Arrow Size | 10 | |
| Thickness | 1 | |
| Position in Precision Layout | X: 326 Y: 116 Width: 402 Height: 195 |
Tip: Manually adjusting the size and location of the line using the drag handles can get a bit tricky, and it's often easier to use the arrow keys and move the other components on the page so they are correctly lined up with the line, rather than the other way around. |
Step 5. Add and Configure Another Simple Line
Add a second simple line to join the crusher and stacker. Straight lines are a bit easier to manually position. Configure the line as follows:
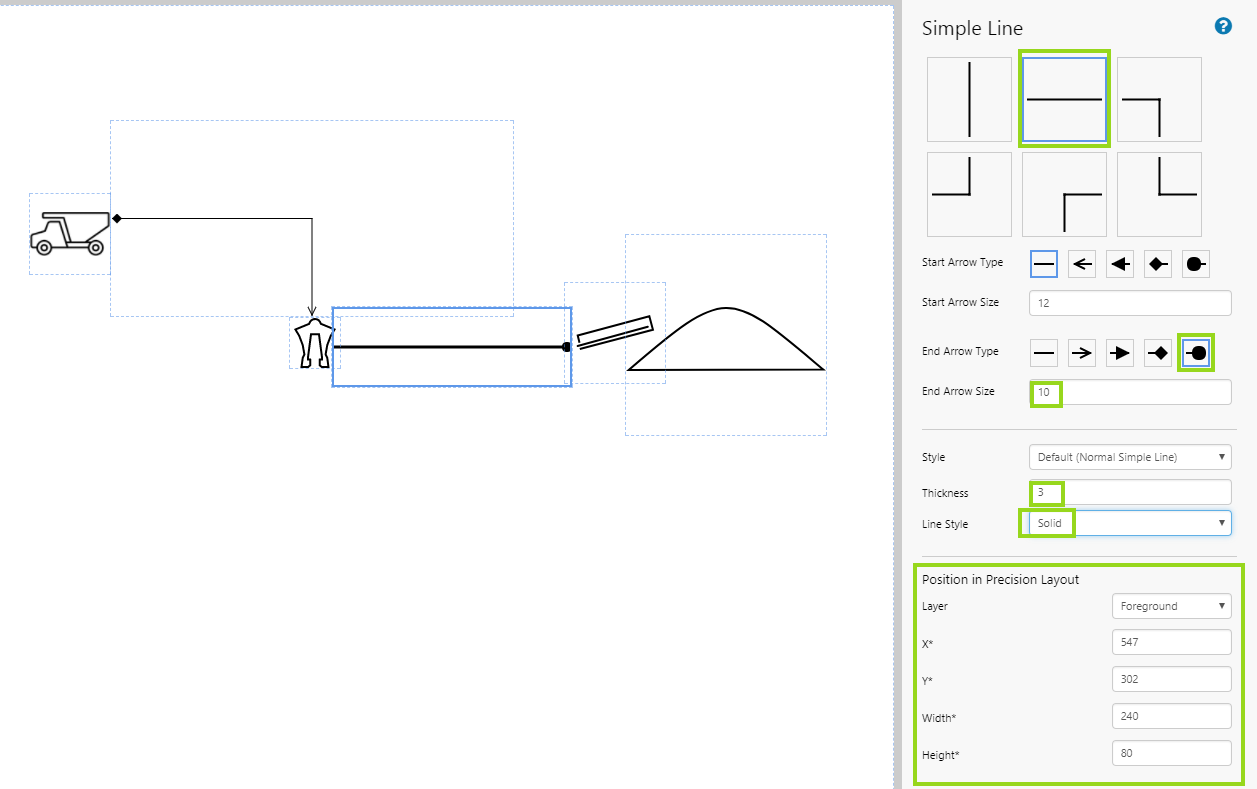
| Direction | Horizontal |  |
| End Arrow Type | Oval | |
| End Arrow Size | 10 | |
| Thickness | 3 | |
| Line Style | Solid | |
| Position in Precision Layout | X: 547 Y: 302 Width: 240 Height: 80 |
Step 6. Add and Configure the Data Labels
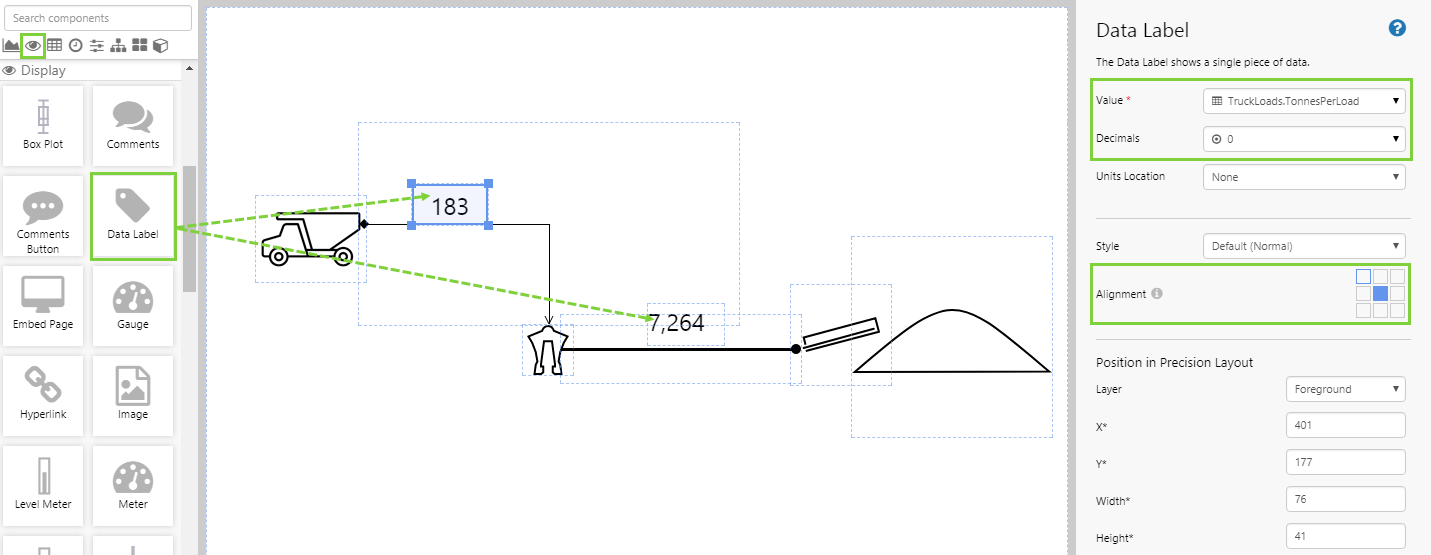
Add 2 Data Labels to the page, position them above the lines, and configure them as follows.
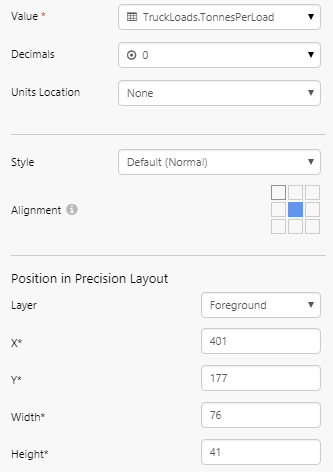
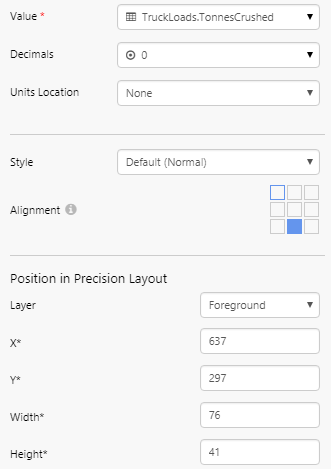
| Data Label 1 | Data Label 2 | |
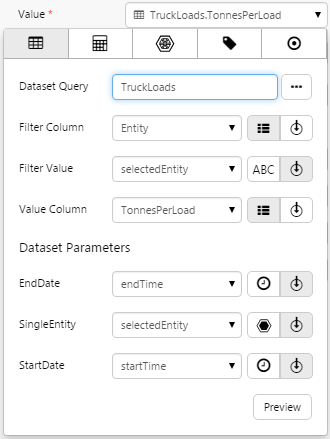
| Value |
Open the Value Data Selector by clicking on the field. Click the Dataset
Tip: Click the Preview button to check that you are getting data. If the preview window is blank, you may have filled in a parameter incorrectly. |
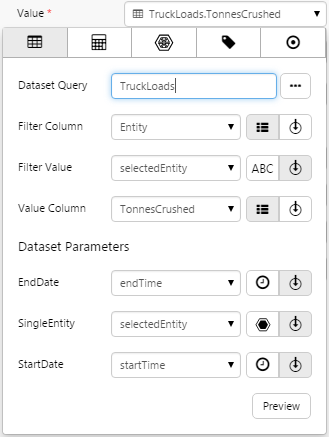
Open the Value Data Selector by clicking on the field. Click the Dataset
|
| Decimals | 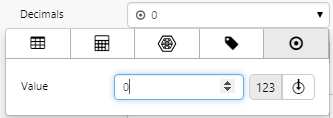 |
|
| Alignment |  |
 |
| Position in Precision Layout | X: 401 Y: 177 Width: 76 Height: 41 |
X: 637 Y: 297 Width: 76 Height: 41 |
 |
 |
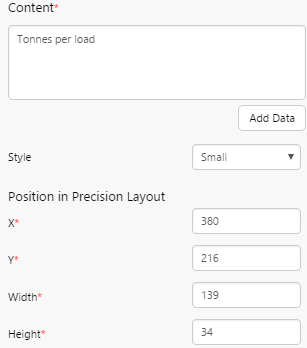
Step 7. Add Text Labels
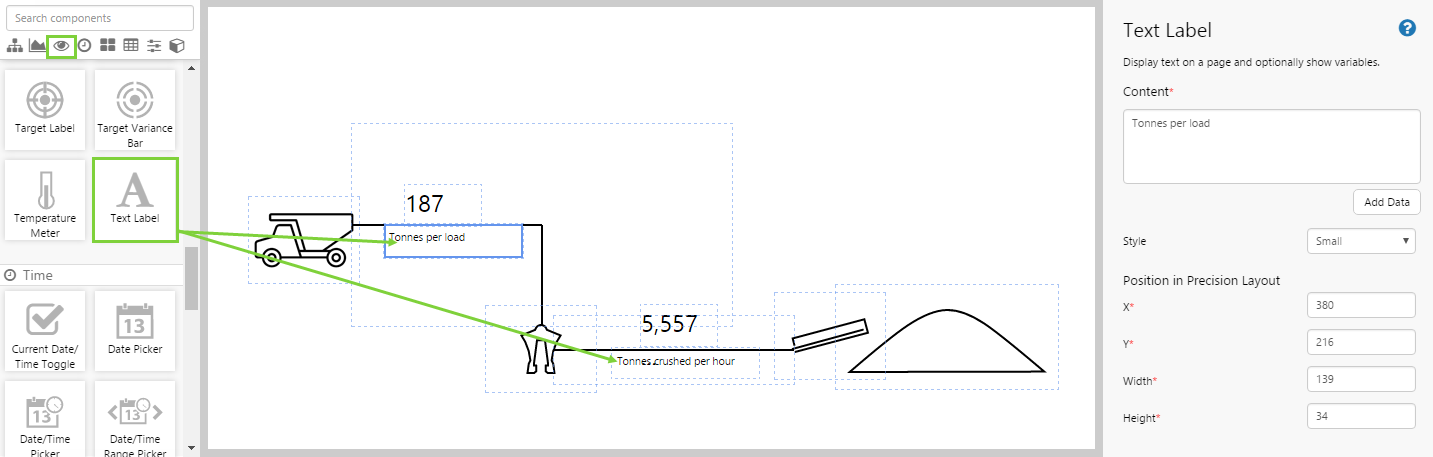
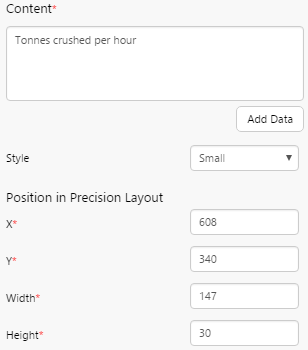
Add 2 Text Labels to the page, position them below the lines, and configure them as follows.
| Text Label 1 | Text Label 2 | |
| Content | Tonnes per load | Tonnes crushed per hour |
| Style (note your styles may differ) | Small Text Label | Small Text Label |
| Alignment |  |
|
| Position in Precision Layout | X: 380 Y: 219 Width: 127 Height: 34 |
X: 608 Y: 346 Width: 147 Height: 30 |
 |
 |
Step 8. Set the Defaults
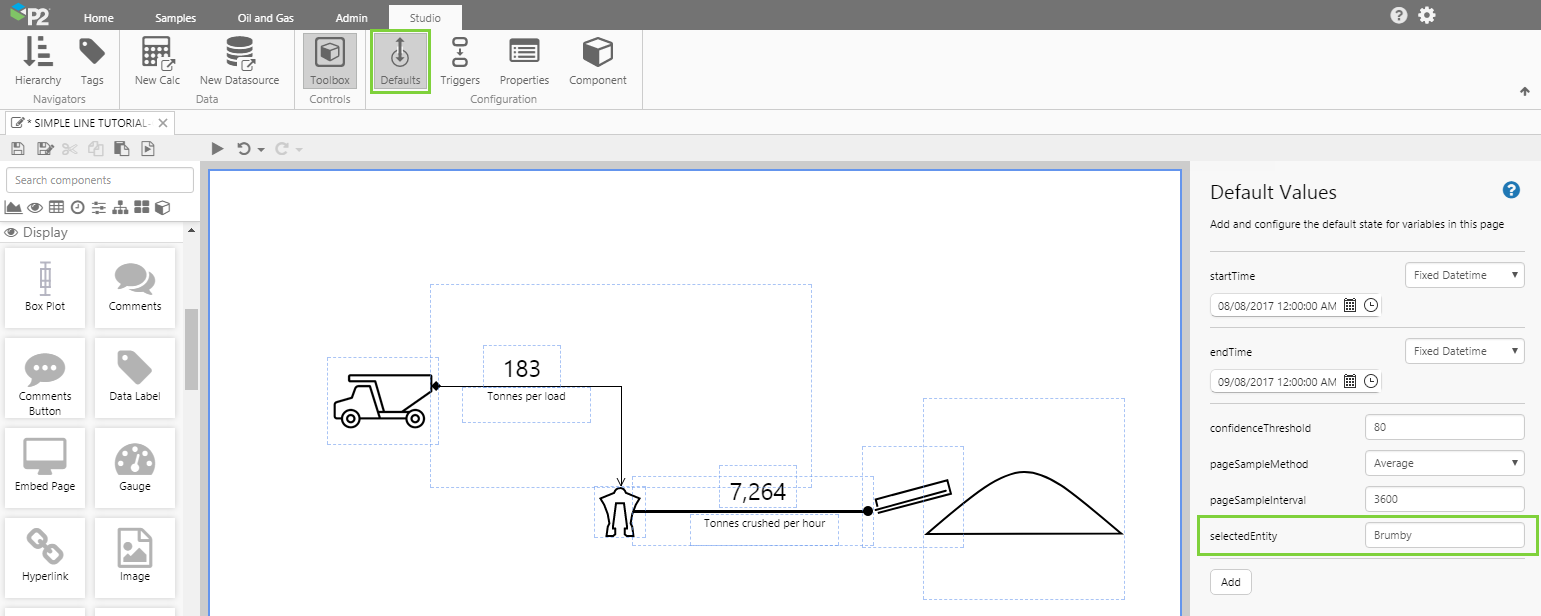
At the moment, the page shows the default values that have been set for the Truckloads dataset in P2 Server. But we are interested in the values for the Brumby mine.
Let’s change the default data that is displayed. We do this by creating defaults for the variables specified in the components in the previous steps. The variable we are most interested in is the selectedEntity variable. Although this variable exists as a default value, no value has been assigned to it. We want the initial value of the Data Labels to show data for the mine, Brumby. We can set that here.
- Click the Defaults button in the Studio tab of the ribbon.
- Update selectedEntity by typing in the following entity name: Brumby
You should now see the Data Labels update to reflect the new default.
Step 9. All done!
Congratulations! You now have a basic mimic consisting of images and labels, that show production on a mine site.
- Click the preview
 button on the Studio toolbar to see what your page will look like in display mode.
![]() Don’t forget to save your page!
Don’t forget to save your page!
Release History
- Simple Line 4.5.3 (this release):
- Added line style as part of style options. The line style can be overridden in Studio.
- Simple Line 4.5.2
- Added arrowhead options and line thickness style override.
- Simple Line 4.4.4:
- The Simple Line component has moved to the Display group in the component toolbox.
- Simple Line 4.4.1
- Initial release